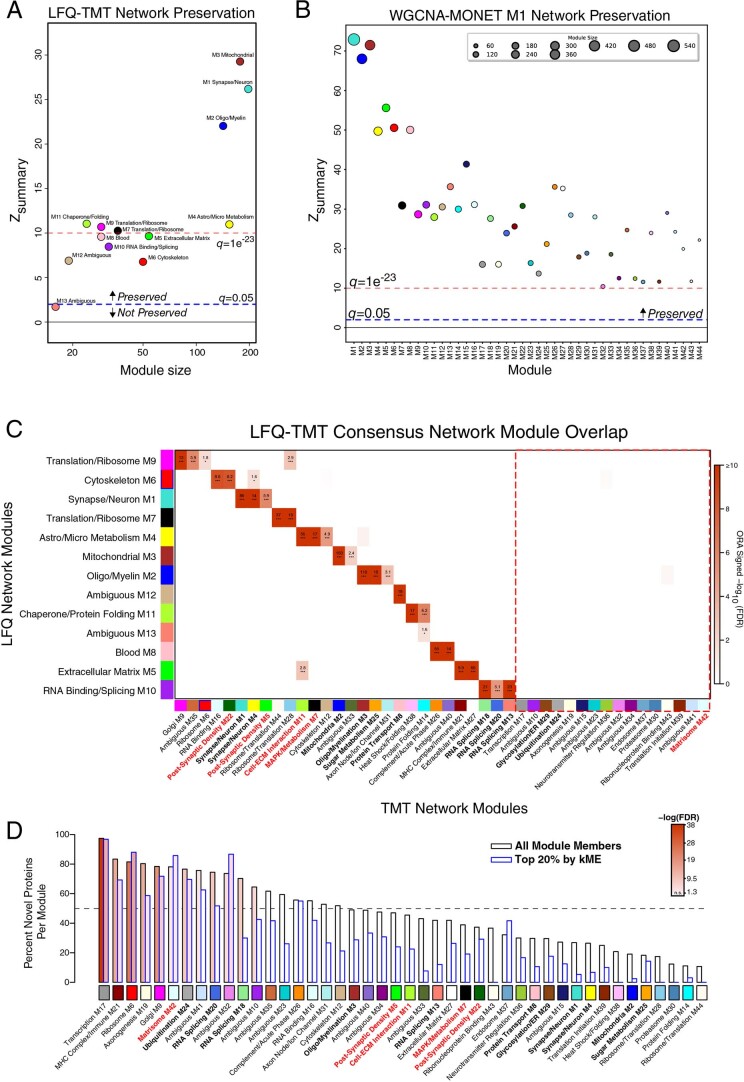
Extended Data Fig. 2. LFQ and TMT AD Network Comparison.
(a–d) LFQ AD network module preservation in the TMT AD network (a). Modules that had a Zsummary score of greater than or equal to 1.96 (or q = 0.05, blue dotted line) were considered to be preserved, while modules that had a Zsummary score greater than or equal to 10 (or q = 1e−23, red dotted line) were considered to be highly preserved. (b) Preservation of the TMT AD network built using the weighted correlational network algorithm (WGCNA) into the network built on the same matrix using the MONET M1 algorithm. (c) Module member overrepresentation analysis (ORA) of the LFQ and TMT AD networks. The dashed red box highlights modules that are unique to the TMT network. The numbers in each box represent the –log10(FDR) value for the overlap. The heatmap is thresholded at a minimum of FDR(0.1) for clarity. (d) Percent novelty of TMT network module protein members compared to LFQ network proteins for all module members (black) or the top 20% of module proteins by strength of correlation to the module eigenprotein (kME) (blue). The dashed line indicates 50% novel protein members. Bars are shaded according to P value significance. ORA and percent novelty P values were corrected by the Benjamini-Hochberg procedure. * <0.05, ** <0.01, *** <0.005.

