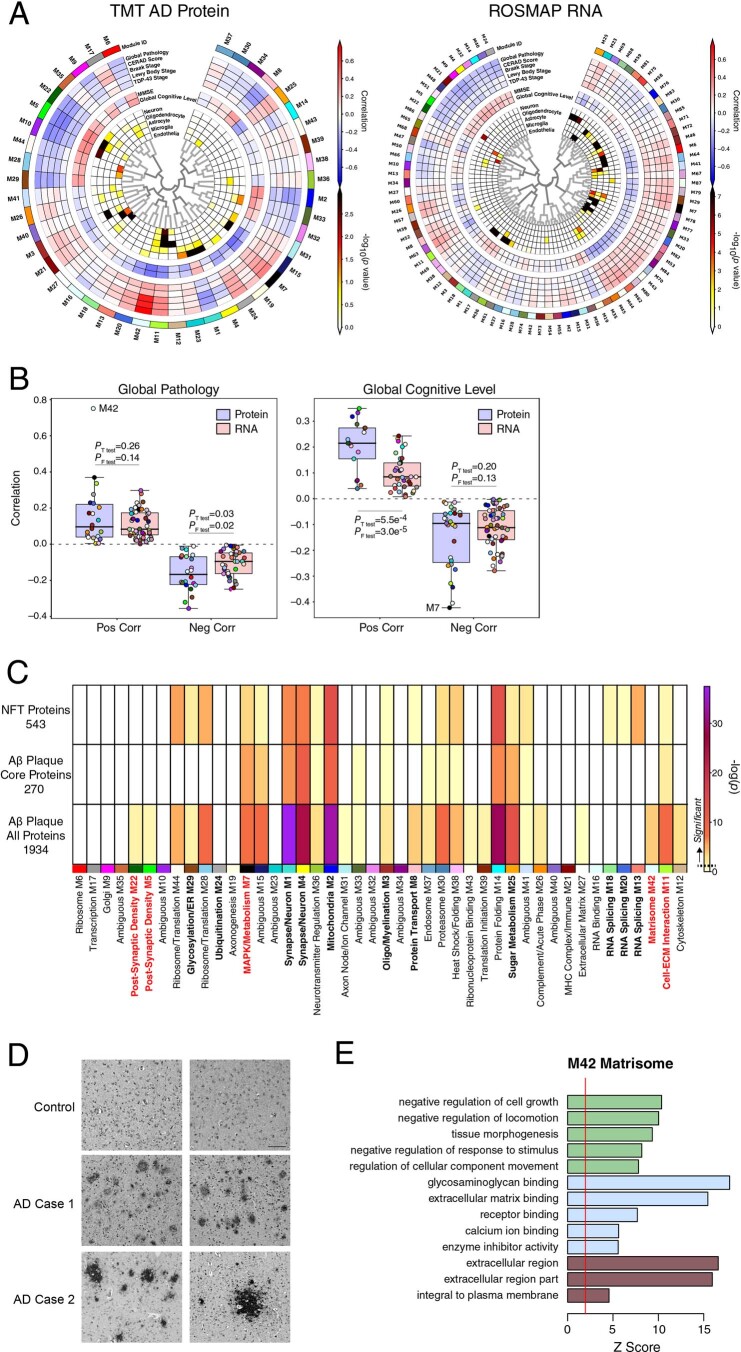
Extended Data Fig. 4. Protein and RNA AD Network Trait Correlations and TMT AD Network Module Overlap with Neurofibrillary Tangle and Aβ Plaque Proteins.
(a-b) Module trait correlation analysis between protein and RNA networks. (a) WGCNA networks of TMT AD protein (left) and ROSMAP RNA (right). Protein and RNA data were obtained from the same brain region (dorsolateral prefrontal cortex, Brodmann area 9), with 168 ROSMAP cases shared between networks. Module eigenprotein to trait correlations are shown by red and blue heatmap. (b) Protein and RNA network module correlations with global pathology (left; n = 22 positive protein, 22 negative protein, 50 positive RNA, 38 negative RNA) and global cognitive level (right; n = 17 positive protein, 27 negative protein, 35 positive RNA, 53 negative RNA) as measured in ROSMAP. Differences in overall positive and negative correlations between protein and RNA modules were assessed by two-sided Welch’s t test, whereas differences in overall variation in correlation were measured by F test. P values for each test are provided. Boxplots represent the median, 25th, and 75th percentiles, and box hinges represent the interquartile range of the two middle quartiles within a group. Datapoints up to 1.5 times the interquartile range from box hinge define the extent of whiskers (error bars). (c) TMT AD network module protein overlap with proteins identified as co-localized with neurofibrillary tangles (NFTs, n = 543) and amyloid-β (Aβ) plaques as described by Drummond et al.30,31. Overlap with Aβ plaques was performed with a set of proteins consistently observed in Aβ plaques across multiple experiments (Aβ plaque core proteins, n = 270), as well as with a set of proteins that included proteins observed only once across multiple experiments (Aβ plaque all proteins, n = 1934). Overlap was performed with one-sided Fisher’s exact test, and corrected by the Benjamini-Hochberg procedure. (d) Immunohistochemistry of midkine (MDK), a hub protein of the M42 matrisome module, in control and AD brain. Two out of three independent experiments are shown as representative. Scale bar represents 500 µM. (E) Gene ontology analysis of the M42 matrisome module, including biological process (green), molecular function (blue), and cellular component (brown) ontologies. The red line indicates a z score of 1.96, or p = 0.05.

