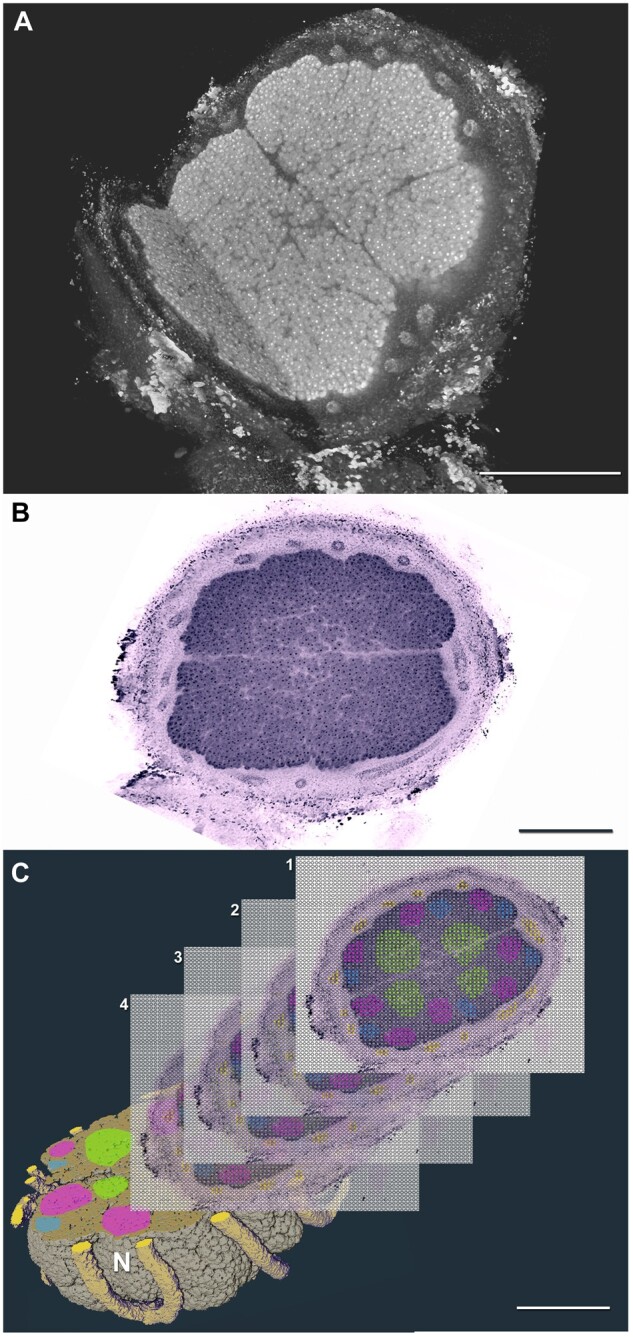
Figure 2.

XRM and ST combined to illustrate localization of gene expression in 3D. A, Volume rendering from XRM scan of a soybean (G. max) nodule formed by nitrogen-fixing bacteria, with 3D cutaway view showing internal nodule structure. B, Physical microtome section collected from fixed and prepared nodule from A, sections are used for ST processing. C, Computationally segmented nodule (N) from A illustrates the 3D volume into which processed ST section data (1–4) are co-registered to identify where in the nodule specific genes are being expressed; the different colors illustrate localized expression of genes-of-interest on the ST sections. Scale bars = 500 μm.
