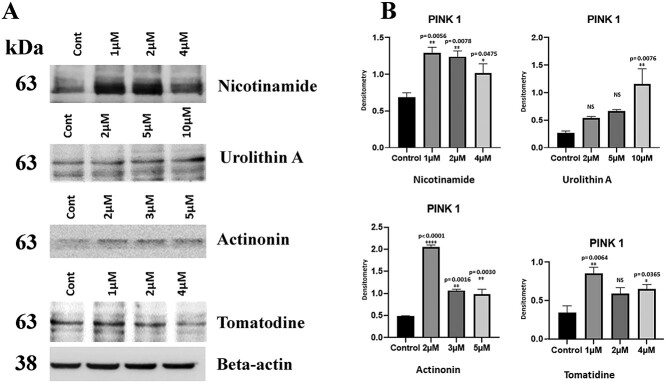
Figure 3.
Immunoblotting analysis of dose response of mitophagy enhancers. (A) Representative immunoblots for control and HT22 cells treated with mitophagy enhancers (nicotinamide riboside, urolithin A, tomatidine, actinonin), with dose dependent manner. (B) Quantitative densitometry analysis of PINK1 proteins.

