
Figure 6.
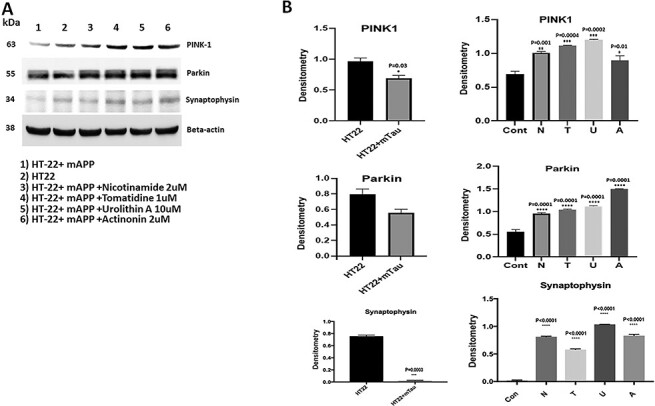
Immunoblotting analysis of mitophagy and synaptic proteins. (A) Representative immunoblots for control HT22 cells and mAPP-HT22 cells with or without mitophagy enhancers. (B) Represents quantitative densitometry analysis of mitophagy and synaptic proteins. Upon mAPP transfection significant reduction were seen in the levels of PINK1 (P = 0.006) and synaptophysin (P = 0.02) But levels of mitophagy and synaptic proteins increased with mitophagy enhancers treatment.