
Figure 9.
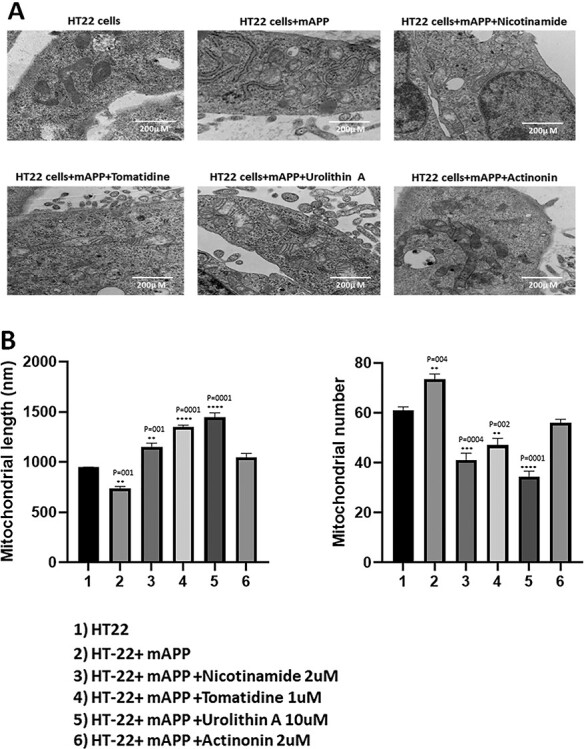
Transmission electron microscopy analysis. Mitochondrial number and length in control HT22 cells and mutant APP cDNA transfected HT22 and treated with mitophagy enhancers for 24 h. (A) Representative transmission electron microscopy images of mitochondria in the untreated HT22 cells and mitophagy enhancers treated mAPPHT22 cells (B) Quantitative analysis of mitochondrial number and length in each of the 6 groups. Significantly increased number of mitochondria were found in HT22 cells transfected with mutant APP relative to untransfected HT22 cells. Mitochondrial length significantly decreased upon mutant APP cDNA transfection. Mitophagy enhancers treatment decreased the mitochondrial number and increased its length in the mAPPHT22 cells.