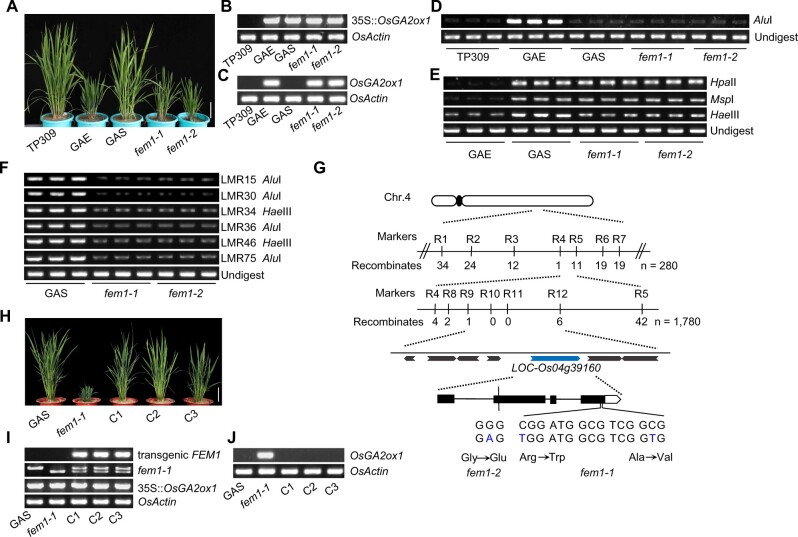
Figure 2.
Map-based cloning of FEM1. A, Morphology of 3-month-old TP309, GAE, GAS, fem1-1, and fem1-2 plants. Scale bar = 10 cm. B, Genotyping transgenic OsGA2ox1. OsActin served as the control. C, The mRNA level of OsGA2ox1 as indicated by semi-quantitative RT-PCR. OsActin served as the control. D, Chop-PCR assay of the gene body of OsGA2ox1. E, Chop-PCR assay of the 35S promoter. F, Chop-PCR assay of endogenous loci. LMR, Losing DNA methylation region. G, Diagram showing the map-based cloning of fem1-1. Mutations of fem1-1 and fem1-2 are indicated. H, Morphology of 3-month-old plants of GAS, fem1-1, and three complementary lines (C1–C3). Scale bar = 10 cm. I, Genotyping of complementary lines. J, The mRNA level of OsGA2ox1 in the indicated genotypes as determined by semi-quantitative RT-PCR.

