Figure 4.
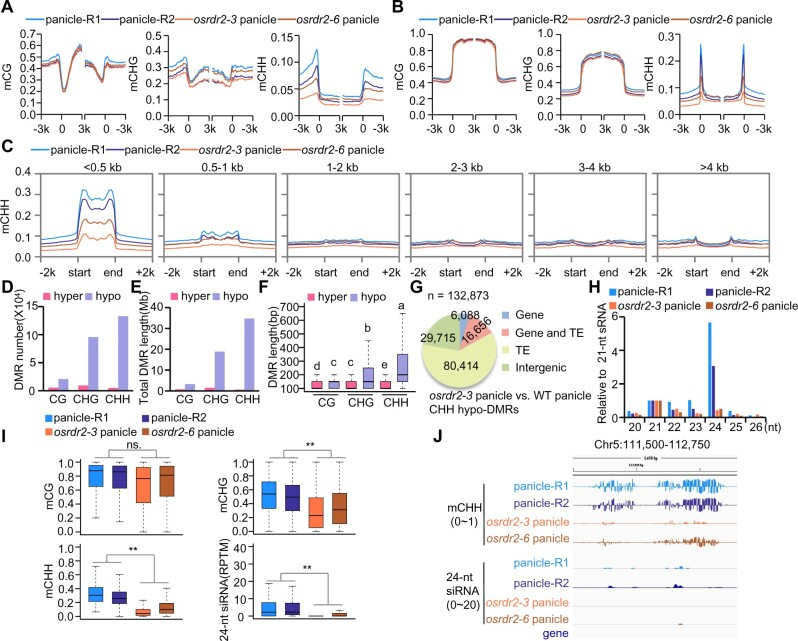
OsRDR2 regulates CHH methylation and 24-nt siRNA biosynthesis. A and B, Average CG, CHG, and CHH methylation levels on genes (A) and TEs (B) in the panicles of various genotypes (R1 represents WT-Replicate 1; R2 represents WT-Replicate 2). C, Average CHH methylation levels on TEs of different lengths in panicles of the indicated genotypes. D and E, The number (D) and length (E) of various DMRs in panicles of osrdr2–3. F, Box plots showing DMR lengths. Different letters indicate a significant difference according to Fisher’s least significant difference (LSD) (P < 0.05). Here and all subsequent box plots, the box indicates the upper and lower quartiles, the black lines are medians, and the whiskers corresponding to the minimum and maximum range. G, Genomic distribution of CHH hypo-DMRs in osrdr2–3 panicles. “Gene” indicates a DMR that overlaps with the gene body; “TE” indicates a DMR that overlaps with the TE body; “Gene and TE” indicates a DMR that overlaps with both the gene body and TE body; “Intergenic” indicates a DMR that does not overlap with either the gene body or the TE body. H, Abundance of small RNAs of different length relative to 21-nt in WT and osrdr2 panicles. I, Box plots indicating the methylation level of CG, CHG, and CHH, and 24-nt siRNA abundance on CHH hypo-DMR in osrdr2–3 panicles (**P < 0.01 by two-tailed z-test). J, Integrated Genome Browser view of CHH methylation levels, 24-nt siRNAs abundance on one representative CHH hypo-DMR in panicles of the indicated genotypes.

