Figure 5.
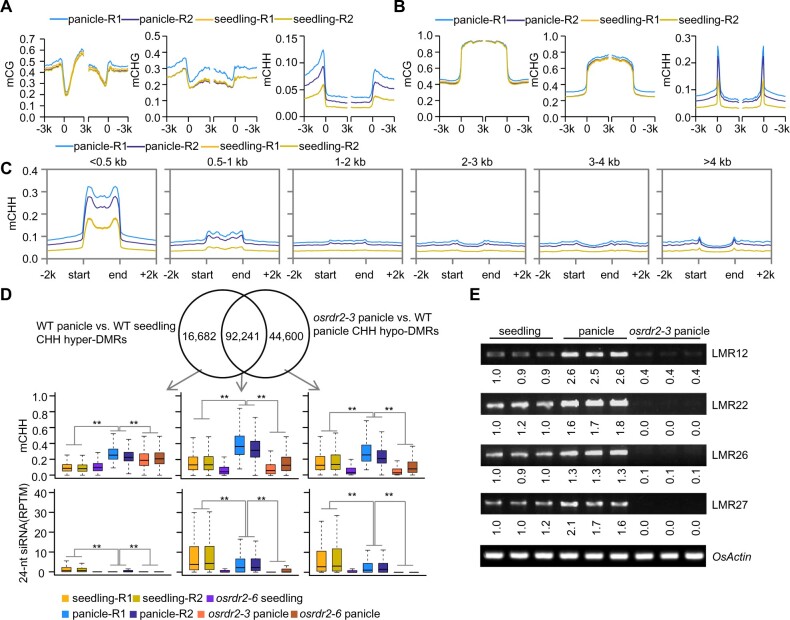
Increase of CHH methylation in panicles depends on OsRDR2. A and B, Average CG, CHG, and CHH methylation levels on genes (A) and TEs (B) in panicles and seedlings. C, Average CHH methylation levels on TEs of different length in panicles and seedlings. D, Venn diagram of the overlap between CHH hyper-DMRs of panicles > seedlings and hypo-DMRs of osrdr2–3 < WT in panicles. Box plots indicate the methylation levels of CHH and 24-nt siRNA abundance on common and specific regions in panicles or seedlings of various genotypes (**P < 0.01 by two-tailed z-test). E, Chop-PCR assay of several panicle CHH hyper-DMRs. Values were calculated relative to the first sample.

