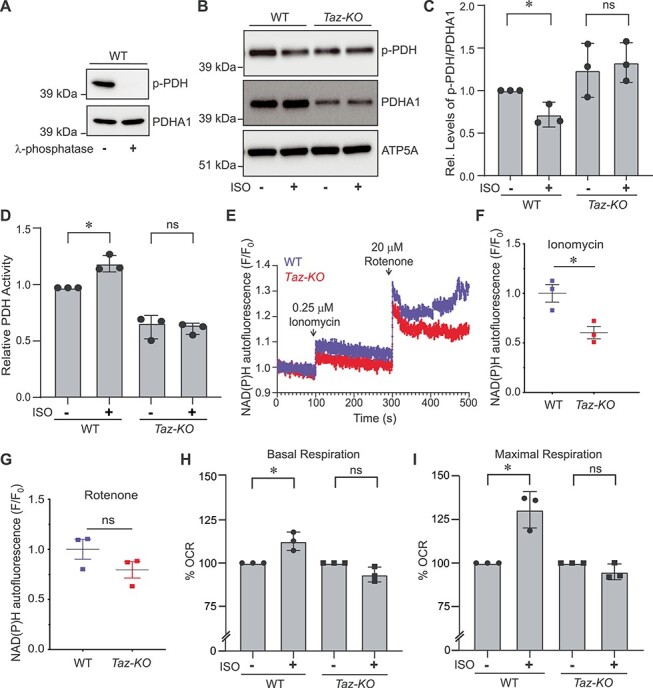
Figure 5.

Ca2+-stimulated mitochondrial bioenergetics is impaired in Taz-KO cells. (A) SDS-PAGE immunoblot analysis of phosphorylated PDH (p-PDH) and total PDH (PDHA1) in C2C12 WT mitochondrial lysate treated with or without λ-phosphatase for 10 min. (B) SDS-PAGE immunoblot analysis of p-PDH and total PDHA1 in mitochondria isolated from C2C12 WT and Taz-KO myoblasts treated either with DMSO or 25 μM ISO for 40 min. ATP5A is used to show equal loading. (C) Quantification of relative p-PDH levels from (B) normalized to total PDHA1 by densitometry using ImageJ software. Data shown as mean ± SD. n = 3. *P < 0.05. ns, not significant. (D) Relative PDH activity in mitochondria isolated from WT and Taz-KO myoblasts treated either with DMSO or 25 μM ISO for 40 min. Data shown as mean ± SD. n = 3. *P < 0.05. ns, not significant. (E) NAD(P)H fluorescence changes in C2C12 WT and Taz-KO cells after sequential additions of ionomycin (0.25 μM) and rotenone (20 μM). (F) Quantification of ΔNAD(P)H fluorescence after ionomycin addition. (G) Quantification of ΔNAD(P)H fluorescence after rotenone addition. Data shown as mean ± SEM. n = 3. *P < 0.05. ns, not significant. (H and I) Basal (H) and maximal (I) oxygen consumption rate (OCR) in intact C2C12 WT and Taz-KO cells treated with either DMSO or 25 μM ISO. Data represented as mean ± SD (n = 15, three biological replicates each with five technical replicates per experiment). *P < 0.05, ns, not significant. CCCP and antimycin A were used to measure maximum respiratory capacity and mitochondria-specific respiration, respectively. OCR data are reported as % OCR normalized to total protein content.
