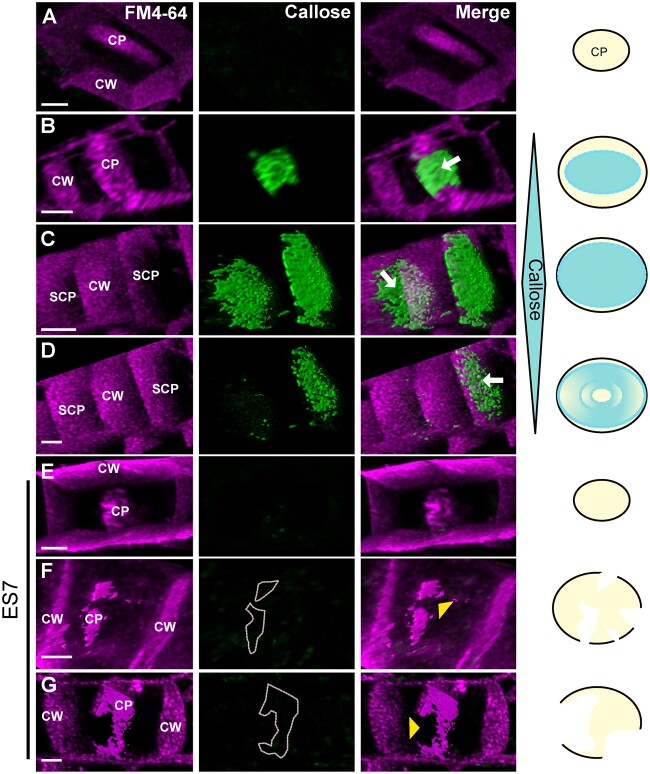
Figure 4.
Progression of the cell plate in the presence and absence of callose. A–D, Cell plate progression in the presence of callose. A, It shows an early stage cell plate before the accumulation of callose, while (B–D) represent later cell plate stages including SCP as indicated in Figure 1D. FM4–64 staining (magenta) is used to stain plasma membrane and the cell plate, while Aniline Blue fluorochrome (green) staining shows callose accumulation. Note the transient accumulation of callose in later stages leading to the maturation of cell plate during normal cytokinesis (B–D). C and D represent two snapshots of a time series. C, Two cell plates can be observed, and as maturation continues to D, callose is eliminated from one cell plate indicating its transient nature. Arrows indicate callose accumulation at the cell plate. E–G, Progression of cytokinesis under ES7 treatment for 2 h that inhibits callose deposition. Note that early cell plate development is not affected with ES7 treatment as shown in earlier studies (Park et al., 2014) (E). However, in late stages of cell plate development under ES7 treatment, the absence of callose prevents the transition into a stable mature single structure, leading to characteristic “cell plate stubs” (F and G). CP indicates cell plate, SCP indicates SCP as depicted in Figure 1. CW indicates cell wall. Yellow arrowheads denote lack of callose at cell plate breakage points. Dotted lines in F, G outline the position where callose should be deposited. Images are 3D reconstructions from Z-stacks of live confocal imaging and show single timepoints. C and D are snapshots of a time series. Figures are representative of root tips from a minimum of 10 Arabidopsis seedlings. A schematic representation on the right indicates the accumulation of callose in relation to cell plate development. White gaps at the bottom indicate cell plate fragmentation. Bars = 3 µm.

