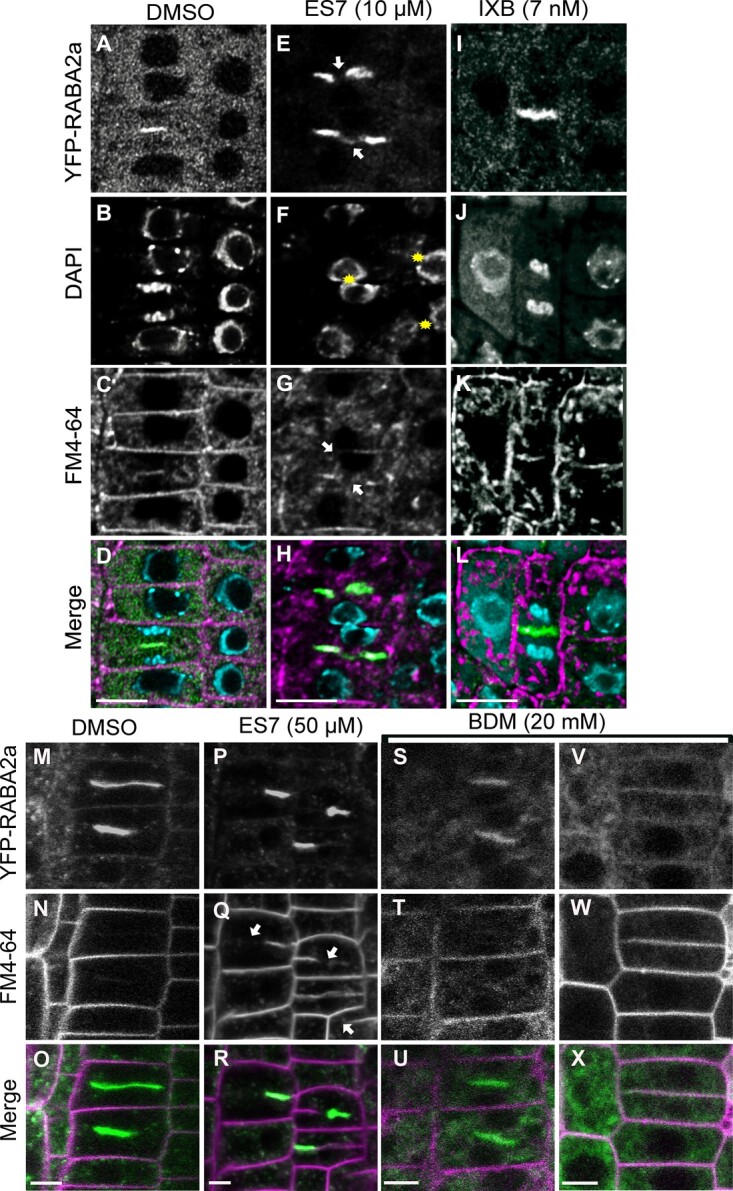
Figure 5.

Comparison of chemical inhibitors of cellulose, callose and myosin on cytokinesis. A–L, Evaluation of cytokinesis inhibition under 5 day chemical treatment in Arabidopsis root tips. Under control DMSO treatment normal cytokinesis is observed (A–D). Under ES7 treatment typical cytokinesis defects are observed with the cytokinesis marker RABA2a (E), multinucleate cells (F) are shown by DAPI staining. Under IXB treatment cell plate progression was observed (I) without discernable cytokinetic defects in the form of binucleate cells (J) or cell plate stubs (I, K, and L). Please note cell swelling under IXB treatment. The cytokinesis marker RABA2a is shown in green, while FM4–64 staining of plasma membrane is shown in magenta. Nuclei staining by DAPI are indicated in blue. Samples were stained with FM4–64FX, fixed and stained post fixation for DAPI. Results were observed in at least six roots for each drug treatment. Samples are single scans of fixed cells. Bars = 10 µm. M–X, Effect of 2 h short-term (50 µM) ES7 and the putative myosin inhibitor 2,3-butanedione 2-monoxime (20 mM BDM) treatment in cytokinesis. Under DMSO control treatment normal progression of cytokinesis is observed (M–O). Under ES7 treatment, characteristic cell plate stubs were observed with RABA2a and the plasma membrane stain FM4–64 (P–R). Under BDM treatment, a reduction of RABA2a signal was observed with increase in cytoplasmic pattern (S–X). The cytokinesis marker RABA2a is shown in green, while FM4–64 staining of plasma membrane is shown in magenta. Samples are single scans of live cell confocal imaging. Results were observed in at least six roots for each drug treatment. Bars = 5 µm.
