Figure S7.
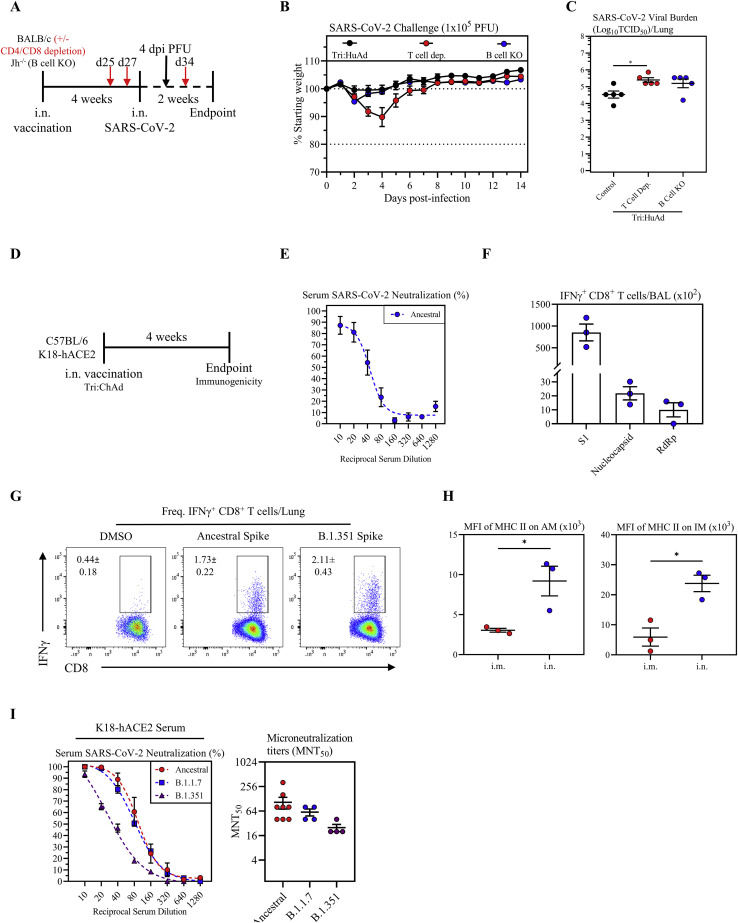
Assessment of B- and T-cell-dependent protection from SARS-CoV-2 infection following intranasal immunization with Tri:HuAd, and characterization of immunogenicity of intranasal immunization with Tri:ChAd vaccine in wild-type C57BL/6 or K18-hACE2 mice, related to Figures 5 and 6
(A) Experimental schema.
(B) Changes in body weight of i.n. Tri:HuAd-vaccinated BALB/c, T-cell-depleted BALB/c, or Jh−/− mice for 2 weeks post-SARS-CoV-2 infection.
(C) Viral burden (Log10TCID50) in the lung of Tri:HuAd vaccinated animals at 4 days post-infection.
(D) Experimental schema.
(E) Serum neutralizing antibody responses at 4 weeks post-immunization in C57BL/6 mice, measured by percent (%) neutralization utilizing a live SARS-CoV-2 microneutralization (MNT) assay.
(F) Absolute number of antigen-specific IFNγ+ CD8+ T cells in the airway at 4 weeks post-immunization in C57BL/6 mice, following ex vivo stimulation with overlapping peptide pools for S1, nucleocapsid, or RdRp.
(G) Flow cytometric dot plots showing frequencies of spike-specific IFN-γ+ CD8+ T cells in lung mononuclear cells at 4 weeks post-immunization in C57BL/6 mice, upon stimulation with either ancestral or variant SARS-CoV-2 spike protein at 4 weeks post-immunization.
(H) MFI of MHC II expression on AM (left) and IM (right) in BAL at 4 weeks post-immunization in C57BL/6 mice.
(I) Left, serum neutralizing antibody responses at 4 weeks post-immunization of K18-hACE2 mice, measured by percent (%) neutralization utilizing a live SARS-CoV-2 ancestral (red), B.1.1.7 (blue), or B.1.351 (purple) microneutralization (MNT) assay. Right, MNT50 values.
Data presented in (B, C, and E–I) represent mean ± SEM. Statistical analysis for (C) was one-way ANOVA with Tukey’s multiple comparisons test. Statistical analysis for (H) was two-tailed t tests. Data are representative of 1 independent experiment, n = 3–5 mice/group. ∗p < 0.05.

