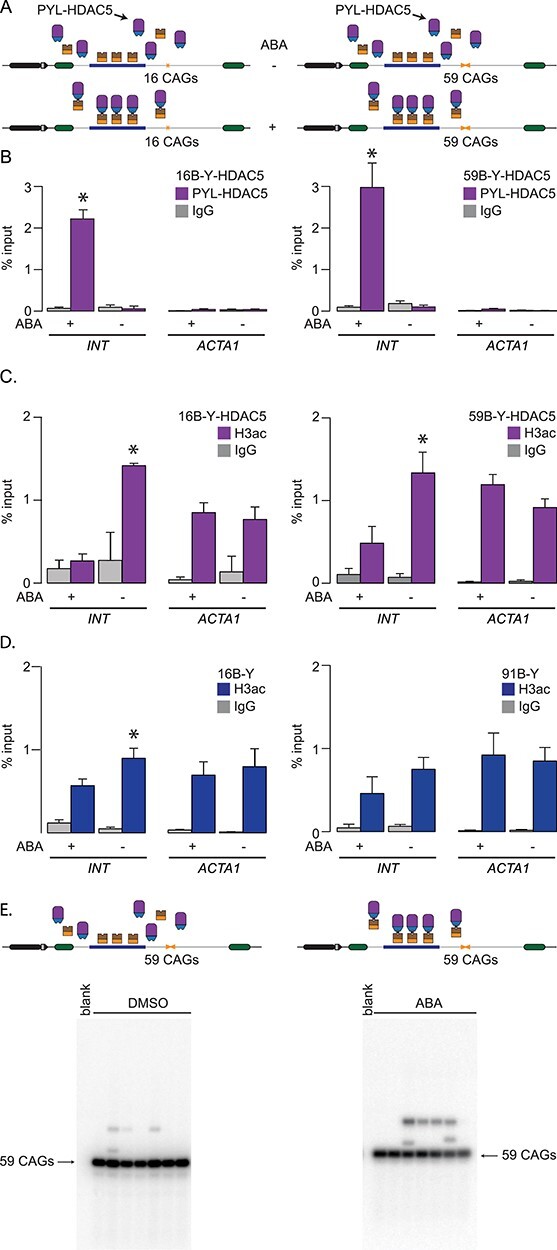
Figure 4.

PYL-HDAC5 targeting reduces acetylation of histone H3. (A) Schematic representation of 16B-Y-HDAC5 (left) and 59B-Y-HDAC5 (right) cells. (B) ChIP-qPCR using antibodies against FLAG to pull down PYL-HDAC5 at INT and ACTA1 in 16B-Y-HDAC5 cells (left, N = 4) and 59B-Y-HDAC5 cells (right, N = 4) after a 5-day treatment with ABA or DMSO. The error bars represent the standard error. (C) ChIP-qPCR data using a pan-acetylated H3 antibody to pull down the INT and ACTA1 loci in 16B-Y-HDAC5 (left, N = 4) and 59B-Y-HDAC5 (right, N = 4) cells after a 5-day treatment with (A). The error bars represent the standard error. (D) ChIP-qPCR data using a pan-acetylated H3 antibody to pull down the INT and ACTA1 loci in 16B-Y (left, N = 4) and 91B-Y (right, N = 4) cells. The error bars represent the standard error. (E) Representative SP-PCR blots after 30 days of continuous culture in the presence of DMSO (left) or ABA (right) in 59B-Y-HDAC5 cells. One nanogram of DNA/reaction used in both cases.
