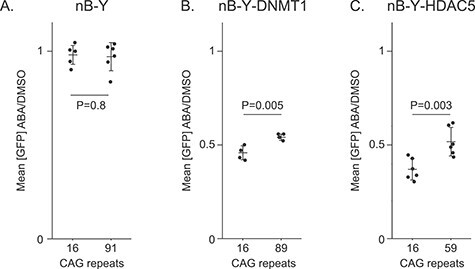
Figure 5.

Effect of expanded CAG/CTG repeats on targeted epigenome editing. Mean GFP intensity ratios between ABA and DMSO alone after 5 days of treatment plotted for (A) 16B-Y cells (same data as in Fig. 2C, N = 6), 91B-Y cells (same data as in Fig. 2C, N = 6), (B) 16B-Y-DNMT1 (N = 4), 89B-Y-DNMT1 (N = 4), (C) 16B-Y-HDAC5 (N = 6), and 59B-Y-HDAC5 (N = 6). P-values were generated using one-way ANOVA.
