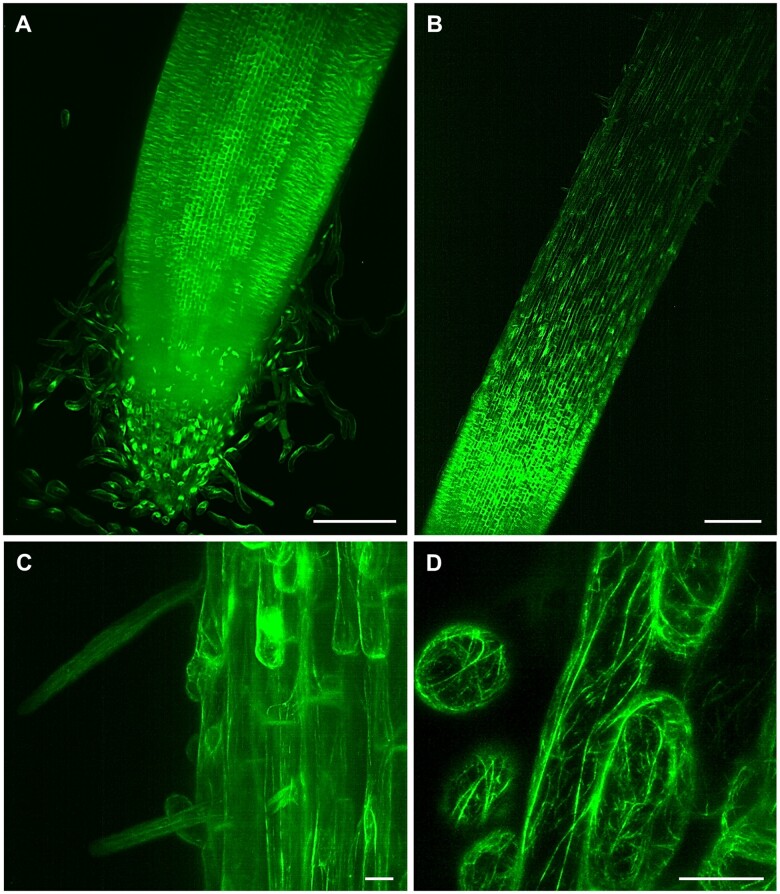
Figure 4.
LSFM of transgenic barley plants with actin cytoskeleton visualized by GFP-FABD2-GFP marker. A, Root apex with root cap and separating border cells, (B, Supplemental Video S10) root elongation and differentiation zone, (C) epidermis with developing root hairs, and (D, Supplemental Video S11) detail on actin filaments in root epidermal cells. Bar = 200 µm (A, B) and 20 µm (C, D). Imaging: W Plan-Apochromat 10×/0.5 NA (B) and W Plan-Apochromat 20×/1.0 NA (A, C and D), 488 nm excitation at 5% (A and B, D) and 10% (C) of relative laser power level, BP505–545 detection, light sheet thickness 6.36 µm (A and B), 4.52 µm (C) and 2.61 µm (D), z-stacks of 1.11 (A), 2.52 (B), 0.48 (C), and 0.45 (D) µm/plane, encompassing the volume of 1217.95 × 1217.95 × 585.76 µm (x × y × z) in (A), 1753.85 × 1753.85 × 567.31 µm (x × y × z) in (B), 438.46 × 438.46 × 160.18 µm (x × y × z) in (C) and 146.00 × 146.00 × 23.01 µm (x × y × z) in (D).

