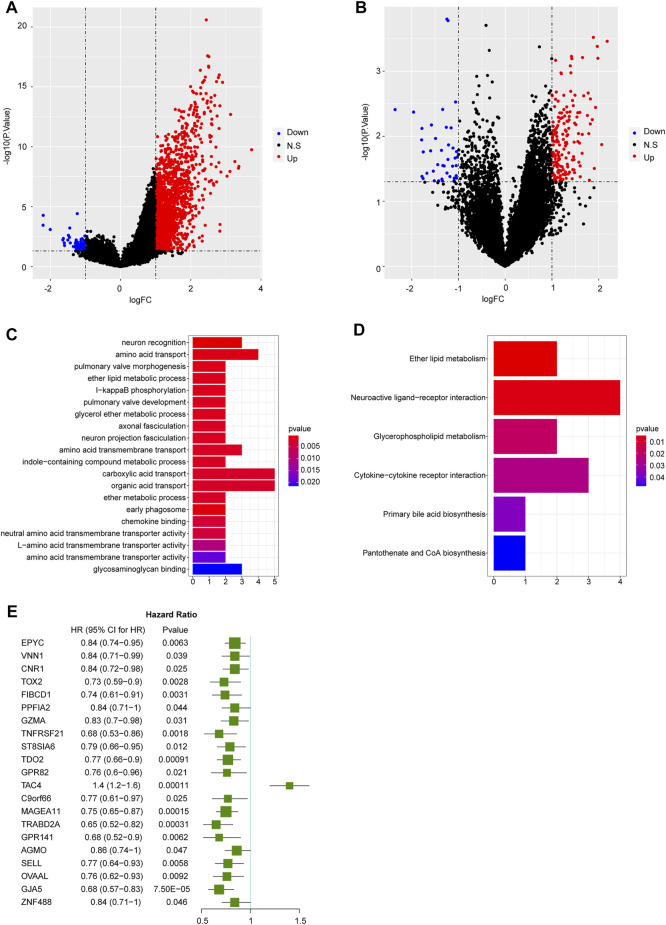
FIGURE 3.
The results of differential expression analyses and functional enrichment. (A) DEGs identified between high and low SELPLG expression OS samples. (B) DEGs identified between metastatic and non-metastatic OS samples. (C) The top 20 most significantly enriched GO terms. (D) Six significantly enriched KEGG pathways. (E) 21 genes were significantly related to the prognosis of OS patients.

