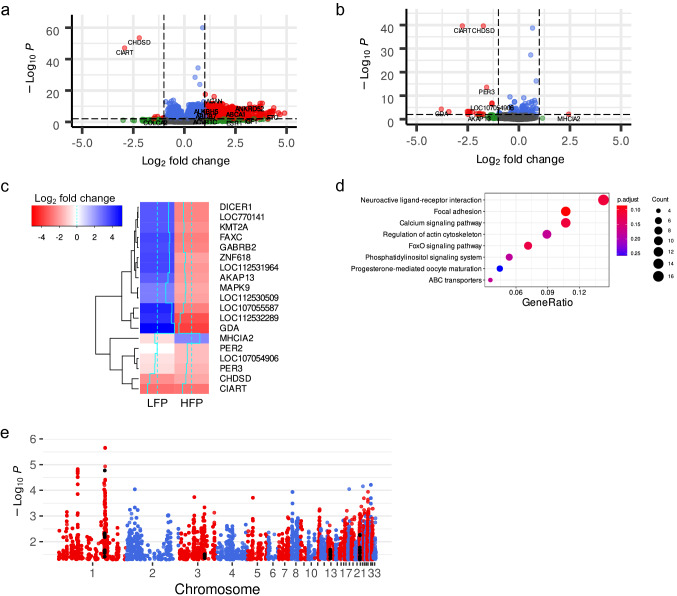
Fig. 1.
Volcano plots of differential gene expression in whole brains from a low feather pecking chickens and b high feather pecking chickens in response to a light stimulus. Grey dots represent transcripts that were not differentially expressed, green transcripts were above an absolute log2 fold change threshold of 1, blue transcripts were below an adjusted p-value of 0.01, and red transcripts were above an absolute log2 fold change threshold of 1 and were below an adjusted p-value of 0.01. Log2 fold change and adjusted p-values threshold are indicated by dashed lines. c Heatmap of log2 fold changes of genes differentially expressed in high feather peckers (HFP) in comparison to low feather peckers (LFP). d Gene cluster analysis results of KEGG pathways for genes differentially expressed in LFP in response to light. e Manhattan plot of GWAS hits with a p-value < 0.05 for the phenotype “feather pecks delivered cox-box transformed” performed on half-sibs convergently selected for feather pecking behavior. Variants in proximity to or located in genes coding for GABA receptors are shown in black

