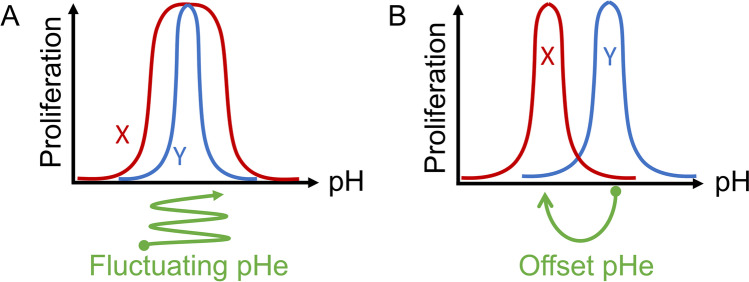
Fig. 3.
Examples of pH sensitivity curve for proliferation. A Cell X has a broader pH optimum compared to cell Y, therefore its survival prospects are higher during fluctuations in pH. Such dynamic changes in pH have been described in tumours. B Cell X has an acid-shifted pH optimum compared to cell Y. If cell X also has a higher metabolic rate, it is likely to drive tissue pHe to a lower level. This would have the effect of giving cell X a survival advantage over cell Y

