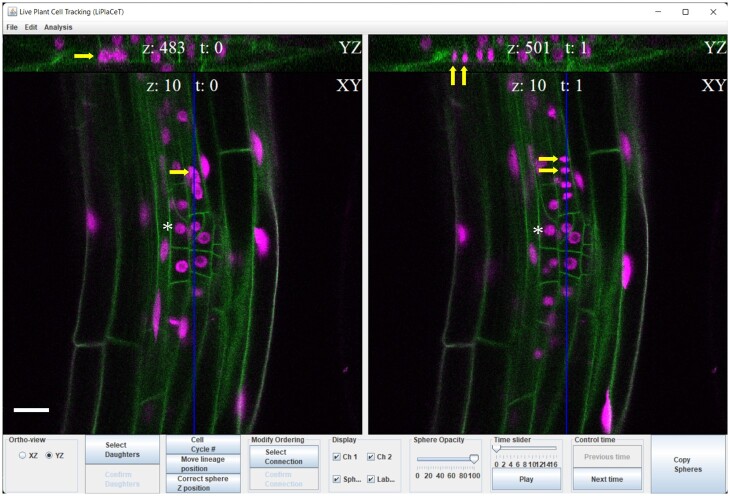
Figure 1.
LiPlaCeT plugin interface for user-friendly cell tracking of 3D images in a time-lapse experiment. LiPlaCeT plugin displays two consecutive frames (t = n and t = n + 1). Within each time frame, a longitudinal section of the root is displayed (XY plane), and the user can choose to display an orthogonal YZ (as shown at the top of the image) or XZ in order to facilitate the identification of a single cell within a 3D image (see also Figure 2). An LRP of a p35S::H2B-RFP pUBQ10::NPSN12-YFP F1 seedling is shown. Asterisks indicate the nucleus of a single cell that was not divided between these two time frames. Yellow arrows on the left (t = n), show a cell before it divided and it can be identified in both XY and YZ orthogonal panels; yellow arrows on the right panel (t = n + 1), show the resulting daughter cells. The blue line in XY shows position of YX section. Scale bar = 20 μm.

