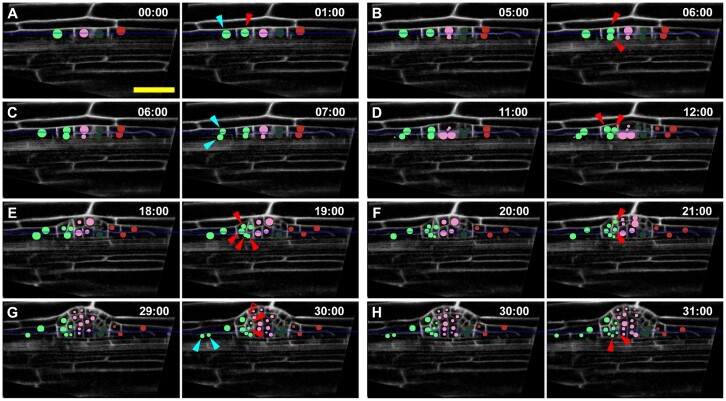
Figure 3.
An example of accurate cell lineage tracking of a developing LRP in a time-lapse experiment using LiPlaCeT plugin. A–H, A “green cell” lineage tracking (green circles) of a developing LRP in p35S::H2B-RFP pUBQ10::NPSN12-YFP F1 seedlings; YFP signal is pseudo colored in gray. When the “green cell” in (A) divides, it produces a central domain (red arrowhead) and a flanking domain (blue arrowhead), the daughters. Each subsequent panels show time points when new daughters of central and flanking daughters are formed, they are marked by arrowheads of corresponding color. All panels show the same Z section. Unfilled red arrowhead in (G) points a location of invisible descendant cells of the upper cell formed in (F); these cells are invisible because they are displaced to a different Z-slice. Numbers indicate time in hours; 00 h is the time of the beginning of the time-lapse analysis. Only some time points of a 48-h experiment are shown, images were acquired each hour. See also Supplemental Movie S2. Scale bar = 50 μm.

