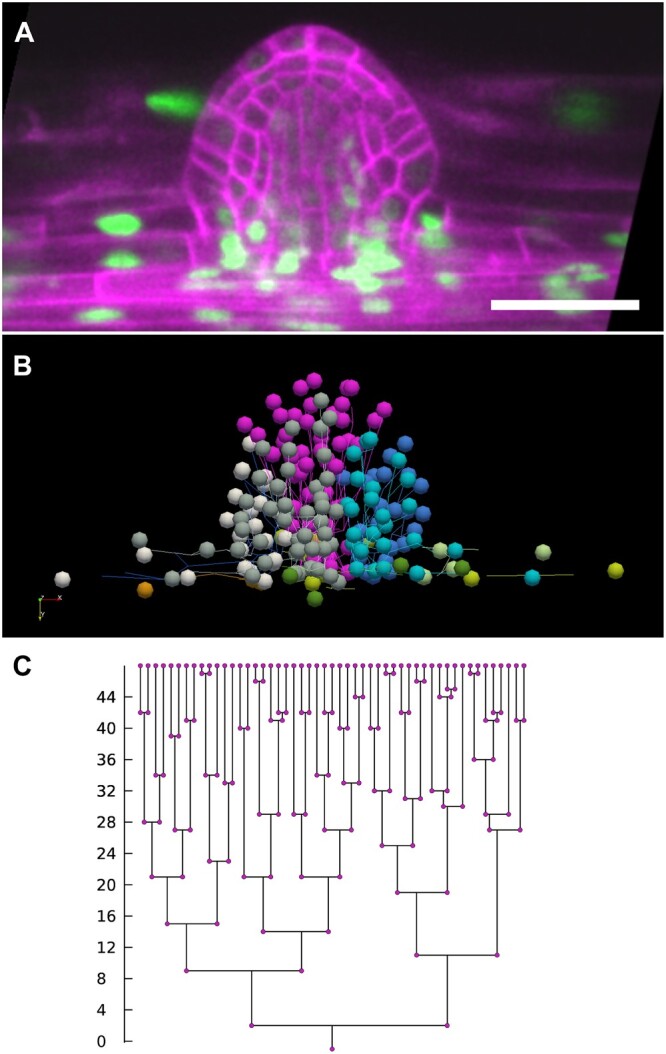
Figure 4.

Analysis of cell lineages in the developing LRP performed with the LiPlaCeT plugin. A, Longitudinal section of the last time point (48 h) of a developing LRP in p35S::H2B-RFP pUBQ10::NPSN12-YFP F1 seedling. Pseudo colors are shown; red nuclei and green plasma membrane colors have been inverted. B, 3D visualization of the same LRP shown in (A), made with ParaView software, of every cell lineage tracked with LiPlaCeT. Different colors indicate different cell lineages produced in a 48-h time-lapse experiment; image stacks were acquired each hour. See also Supplemental Movie S1. C, Cell genealogy tree of a pink cell lineage shown in (B). Scale bar = 50 μm.
