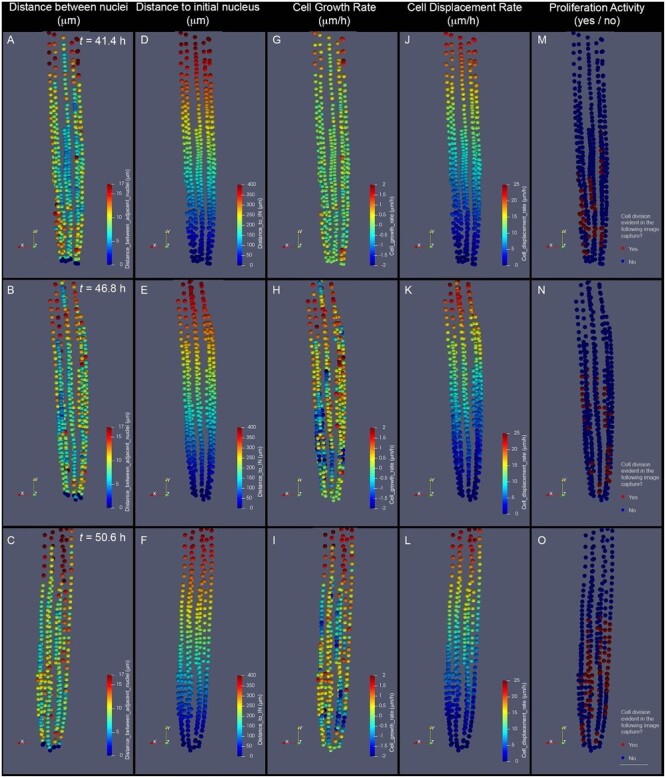
Figure 7.

Parameters of cell dynamics extracted from cell tracking and evaluated as 3D descriptions. A–C, dN. D–F, Distance to the IN (nucleus of an initial cell). G–I, CGR. J–L, CDR. M–O, Cell proliferation distribution. The depicted images represent the RAM of the same growing root, imaged at three subsequent time points after beginning a time-lapse experiment: 43.4 h (A, D, G, and J), 46.8 h (B, E, H, and K), and 50.6 h (C, F, I, and L). Our analysis pipeline integrates this information and generates color-coded representations of each evaluated nucleus. Quantitative parameters are represented as intensity scales to facilitate whole-tissue visualization. dN, measured in micrometer (A–C), is estimated by measuring the distance between each nucleus and the adjacent distal (rootward) nucleus within a cell file. Distance to IN measured in micrometers (D–F) is estimated by measuring the distance between each nucleus and the nucleus of the initial cell of each cell file. CGR, measured in micrometers per hour (G–I), is estimated by comparing dN values in the displayed time (tn) with those of the previous time point (tn−1). This value represents an approximation of the rate at which cells grew during the last evaluated time frame. CDR, measured in micrometers per hour (J–L), is estimated by comparing values of dI in the displayed time (tn) with those of the previous time point (tn−1). This value represents an approximation of the rate at which each cell was displaced from the most distal cell of the file during the last evaluated time frame. Proliferation activity, evaluated as a yes (red label) or no (blue label) value (M–O), represents whether or not each depicted nucleus belongs to a cell that will divide before or at the following time point evaluated (tn+1). To calculate CGR and CDR of cells depicted in (G) and (J), tn−1 corresponds to 33.8 h (data not shown). To determine Proliferation activity of cells depicted in (O), tn+1 corresponds to 54.2 h (not shown). The images shown are 2D representations of 3D whole-tissue reconstructions. For clarity purposes, the color density and size of the dots that represent nuclei were adjusted in these images to obscure nuclei behind them. Scale bar = 50 μm.
