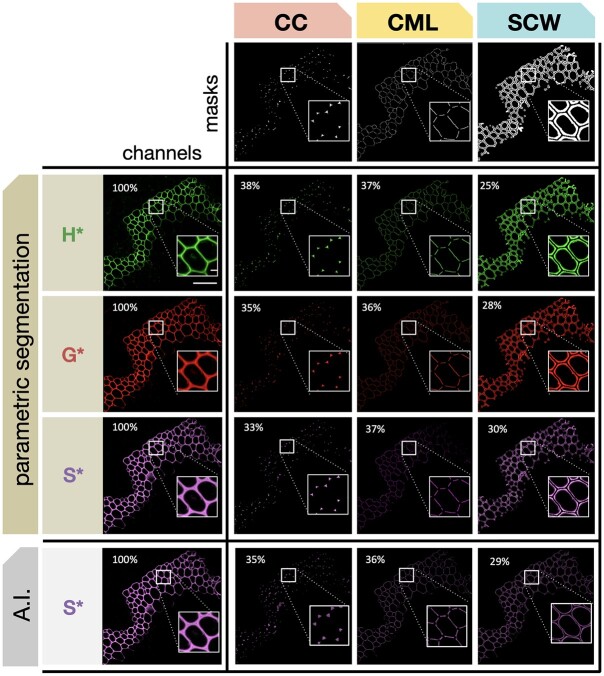
Figure 4.
Automatic segmentation of different cell wall zones. The three masks (CC, CML, or SCW) are applied to cross-sections of Arabidopsis stems in which lignin has been labeled by the triple bioorthogonal strategy. Masks are applied to the three fluorescence channels corresponding to H*, G*, and S* reporters. Percentage values indicate the relative proportion of total reporter signal intensity determined for each cell wall zone by PS (H*, G*, and S*) or AI segmentation where the value for S* is shown for comparison (see Table 1 for corresponding H* and G* values). Scale bar main image = 50 µm, scale bar insert = 5 µm.

