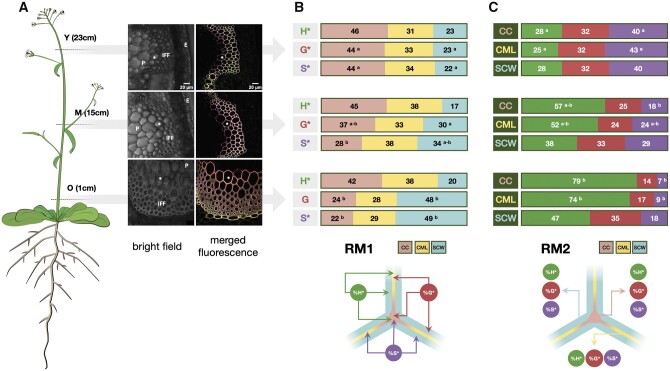
Figure 5.
Monolignol reporter incorporation profiles in Arabidopsis stem fiber cell walls. A, CLSM images of IFF bundles in Arabidopsis stem cross-sections (Left) cartoon of plant indicating regions used to prepare cross-sections, Y = “young” stem region (23 cm from the base of the floral stem), M = “medium” stem region (15 cm from the base), O = “old” stem region (1 cm from the base), total stem height = 30 cm; (Right) bright-field image of stem region showing fibers analyzed and merged green (H*/DBCO-PEG4-Rhodamine Green), red (G*/Azide-fluor 545), and magenta (S*/tetrazine-Cy5) channels revealing monolignol reporter incorporation in fiber cell wall lignin during metabolic feeding. P, pith, E, epidermis, * indicates the same cell shown in the merged image, scale bar = 20 µm. B, Relative distribution of each reporter incorporated into different fiber cell wall zones in Y, M, and O stem cross-sections analyzed by RM1, figures represent the percentage of total signal for a given reporter incorporated into the different wall zones, different letters indicate significantly different values (ANOVA, P-value < 0.05) between Y, M, and O sections, the absence of a letter indicates that differences are not significant. C, Relative contribution of all reporters to total signal in a given cell wall zone analyzed by RM2, figures represent the percentage contribution of each reporter’s signal to total signal intensity in each cell wall zone, different letters indicate significantly different values (ANOVA, P-value < 0.05) between Y, M, and O sections, the absence of a letter indicates that any differences are not significant.

