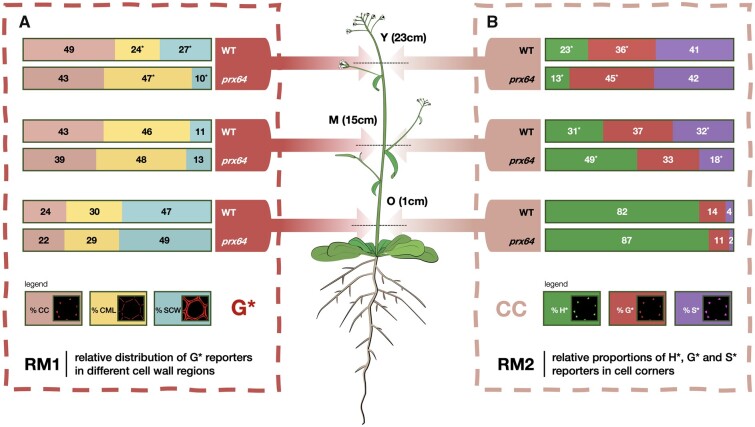
Figure 6.
Example comparison of monolignol reporter incorporation profiles in WT and prx64 mutant Arabidopsis stem fiber cell walls. A, Relative distribution of G* reporter incorporated into different fiber cell wall zones in Y, M, and O stem cross-sections analyzed by RM1, figures represent the percentage of total G* signal incorporated into the different wall zones, Values marked with * indicate significantly different values (Students t test, P-value < 0.05) between WT and mutant plants for a given stem height (Y, M, and O). B, Relative contribution of all reporters to total signal in the CC analyzed by RM2; figures represent the percentage contribution of each reporter’s signal to the total CC signal intensity, Values marked with * indicate significantly different values (Student’s t test, P-value < 0.05) between WT and mutant plants for a given stem height (Y, M, and O). Corresponding figures for H* and S* probes (RM1) and CML and SCW zones (RM2) are shown in Supplemental Figure S3.

