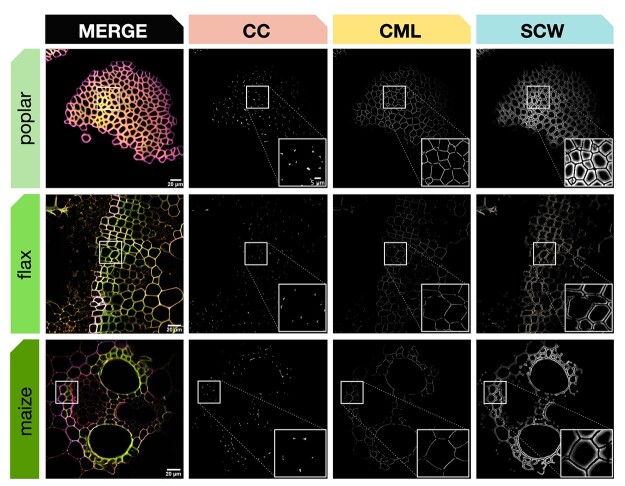
Figure 7.
Automatic segmentation applied to different plant species. Top line: poplar stem bark fibers, middle line: flax stem xylem, bottom line: maize stem vascular bundle. First column: merged CLSM image of green, red, and magenta fluorescence channels, second to fourth columns: cell wall zone segmentation for CC, CML, and SCW. All samples were labeled by the triple lignin bioorthogonal chemical reporter strategy with H*, G*, and S* monolignol reporters. Square frames indicate the sample region magnified (bottom RHC, Columns 2–4). Scale bar main image = 20 µm, scale bar insert = 5 µm.

