Figure 2.
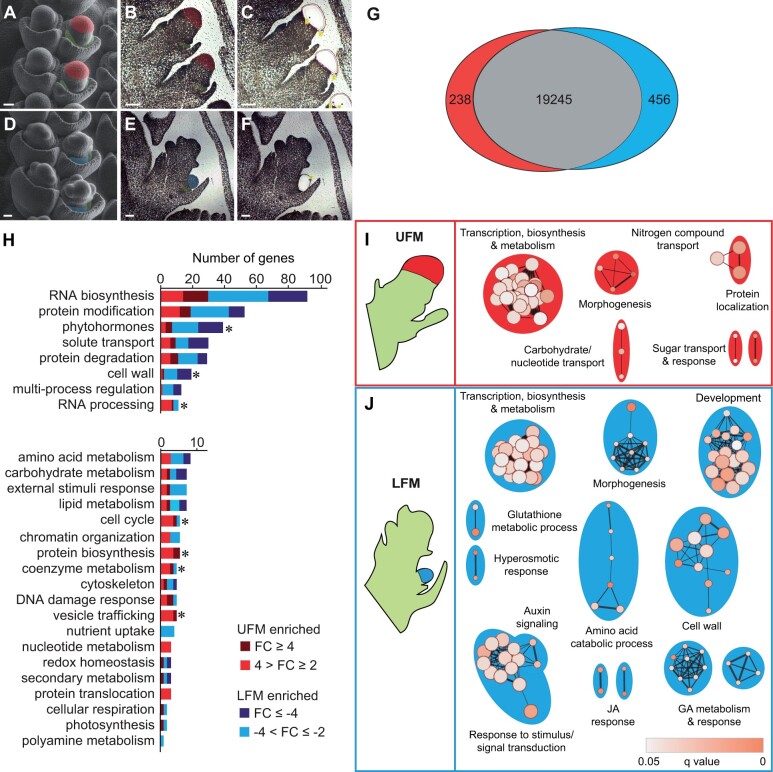
Maize upper and lower FMs are enriched for genes belonging to distinct functional groups. Scanning electron micrographs (SEMs) of spikelets at developmental stages of UFM (A) and LFM (D) dissections. Representative images of FM before (B and E) and after (C and F) LCM. False coloring indicates UFM (red), LFM (blue), and lemma primordia (green). G, Venn diagram depicting DEGs (q < 0.05 and fold change ≥2) in UFM (red) and LFM (blue). H, Distribution of DEGs in MapMan-annotated functional groups. Note difference in scale of the X-axis. Asterisk indicates P < 0.05 in Wilcoxon rank sum test. Genes unassigned to a functional group (99 UFM-enriched and 227 LFM-enriched) are not shown. I and J, GO-enrichment maps for UFM and LFM DEGs. Nodes (circles) indicate significantly enriched GO terms. Node size is proportional to number of DEGs in each node; node color indicates statistical significance. Edges (lines) link similar GO terms. Edge thickness is proportional to the number of DEGs shared between GO terms. Node clusters were manually labeled based on corresponding GO terms in each cluster. Scale bars = 50 μm.

