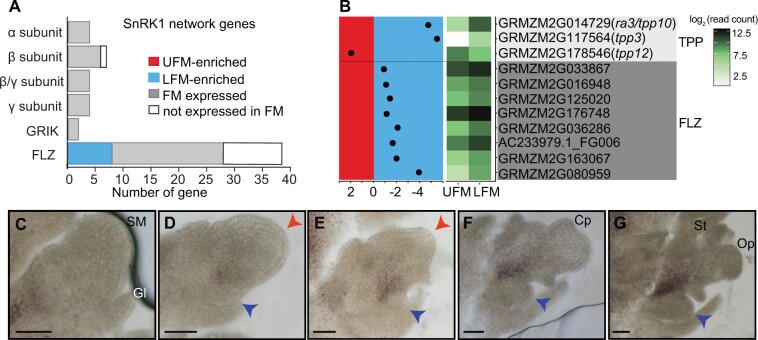
Figure 6.
Sugar metabolism likely differs in UFM and LFM. A, Summary of predicted SnRK1 signaling network genes expressed in FM samples. B, Expression profiles for sugar-related DEG; layout is the same as cell wall-related genes in Figure 4. C–G, Starch accumulates at the boundary between the UFM and LFM in developing spikelets. Red and blue arrowheads indicate UFM and LFM respectively. SM, spikelet meristem; Gl, glume; Cp, carpel primordia; Op, ovule primordia; St, stamen. Scale bars = 50 μm.

