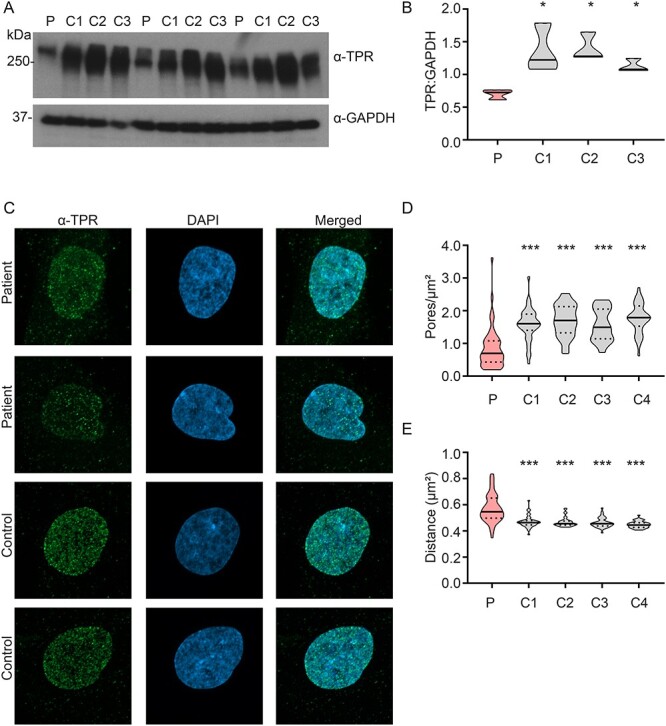
Figure 2.

Decreased TPR steady-state levels and decreased TPR-containing NPC density in patient fibroblasts. (A) Western blot of TPR in patient fibroblasts (P) and three controls (C1-C3). (B) Densitometry shows significantly reduced TPR levels in patient fibroblasts compared to controls. N = 3 biological samples/cell line, two technical repeats. One-way ANOVA with Sidak’s multiple comparisons test; *P < 0.05. (C) Compressed Z-stack representative immunostained images of TPR (green spots) and nucleus (DAPI; blue) in patient fibroblasts and controls. (D) Quantification of TPR-containing NPC pore density (pores per μm2 of nuclear surface area) in patient fibroblasts compared to controls shows a significant decrease in patient fibroblasts. N = 3 biological samples/cell line, pooled data from 38–50 nuclei/cell line. One-way ANOVA with Sidak’s multiple comparisons test; ***P < 0.001. (E) Distance to the nearest TPR-immunostained pore neighbour measurement shows a significant increase in distance in patient fibroblasts compared to controls, indicating more sparsely distributed TPR-containing NPCs in patient fibroblasts. N = 3 biological samples/cell line, pooled data from 38–50 nuclei/cell line. One-way ANOVA with Sidak’s multiple comparisons test; ***P < 0.001.
