Figure 5.

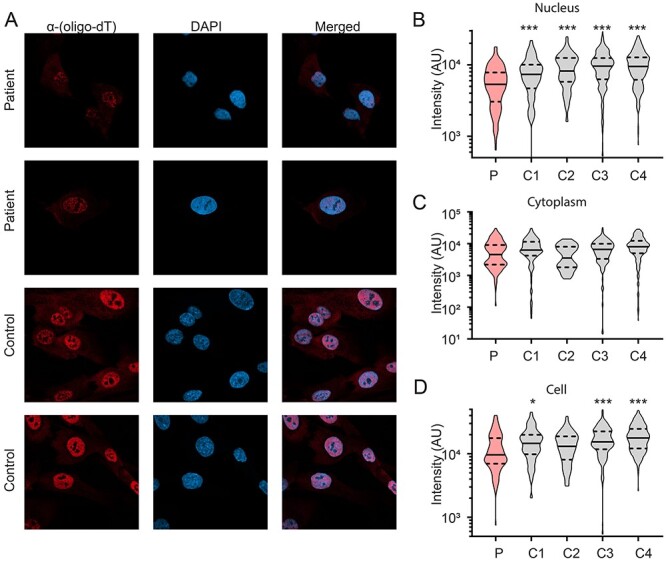
Decreased nuclear poly(A) + RNA intensity in patient fibroblasts. (A) Representative images of the distribution of poly (A) + RNA determined by in situ hybridization with a biotinylated oligo-dT 50-mer in patient fibroblasts (red) and nucleus (DAPI; blue). (B) Quantification of RNA-FISH intensity in the nucleus revealed a significant reduction in patient fibroblasts (P) compared to control fibroblasts (C1—C4). N = 3 biological samples/cell line, pooled data from 39–223 cells/cell line. One-way ANOVA with Sidak’s multiple comparisons test; **P < 0.01, ***P < 0.001. (C) RNA was distributed evenly in the cytoplasm between patient fibroblasts compared to control cells. (D) The total intensity of RNA-FISH in the whole cell was much lower in patient fibroblasts compared to three of the four controls, likely due to the difference in nuclear intensity described in B. N = 3 biological samples/cell line, pooled data from 39–223 cells/cell line. One-way ANOVA with Sidak’s multiple comparisons test; *P < 0.05, ***P < 0.001.
