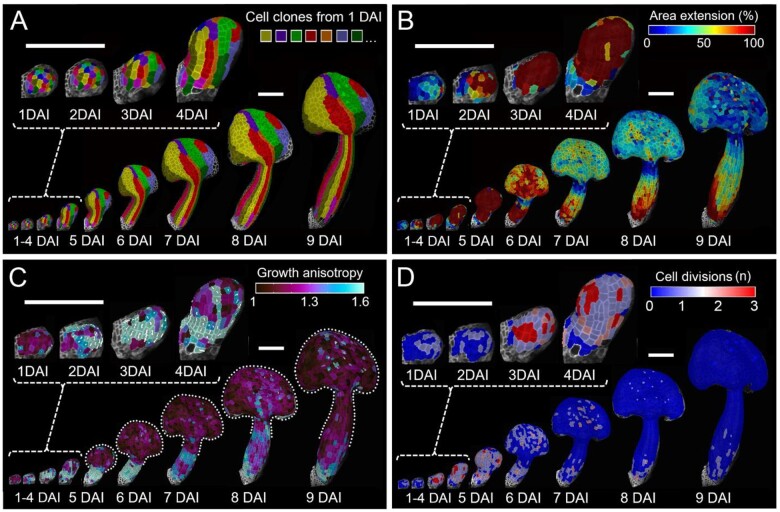
Figure 2.
Developmental patterns of A. thaliana stamen. A, Cell-lineage tracing in the young stamen. Colors indicate clones developing from single cells at 1 DAI displayed on the digitally extracted organ surface. B–D, Heat maps of area extension (B), growth anisotropy (C), and cell proliferation (D). B–D, Heat maps generated between two consecutive time points are displayed on the digitally extracted organ surface at the earlier time point. Dotted lines in (C) mark stamen outlines for clarity. White lines in (C) indicate cell-growth orientation where anisotropy >40%. Scale bars, 100 µm.

