
Figure 3.
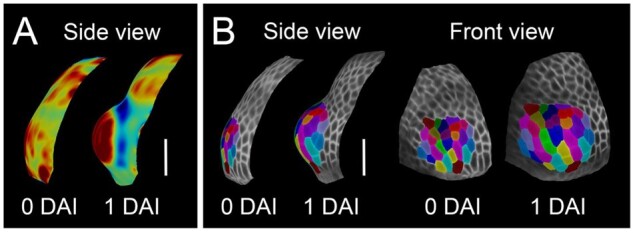
Stamen initiates from 28 ± 2 epidermal cells. A, Heat maps of Gaussian curvature from red (positive) to blue (negative) of the initiating primordium (displayed on the digitally extracted organ surface). B, Cell-lineage tracing in the initiating primordium. Colors indicate clones developing from single cells when stamen primordium initiates displayed on the digitally extracted organ surface. Scale bars, 20 µm.