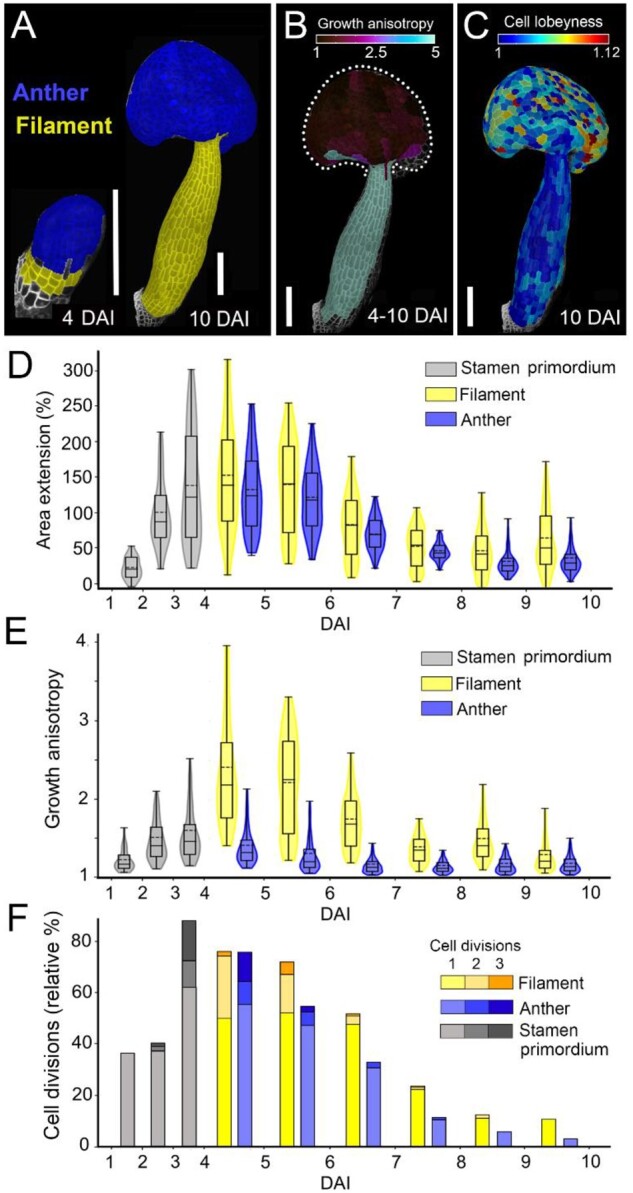
Figure 4.

Anther and filament are specified at 4 days after stamen initiation and display different growth characteristics. A, Lineage tracing of anther (blue) and filament (yellow) between 4 and 10 DAI displayed on the digitally extracted organ surface. B, Heat map of growth anisotropy from 4 to 10 days after stamen initiation displayed on the digitally extracted organ surface. Dotted line marks stamen outline for clarity. C, Heat map of cell lobeyness at 10 DAI. D–F, Quantification of area extension (D), growth anisotropy (E), and cell divisions (F). Violin plots contain 95% and boxplots 90% of the values, respectively. The boxes indicate the range between the first and the third quartile and the whiskers include 90% of the values. Lines represent median and dashed lines represent the mean (three independent time-lapse series; n > 55 cells). Scale bars, 100 µm in (A–C).
