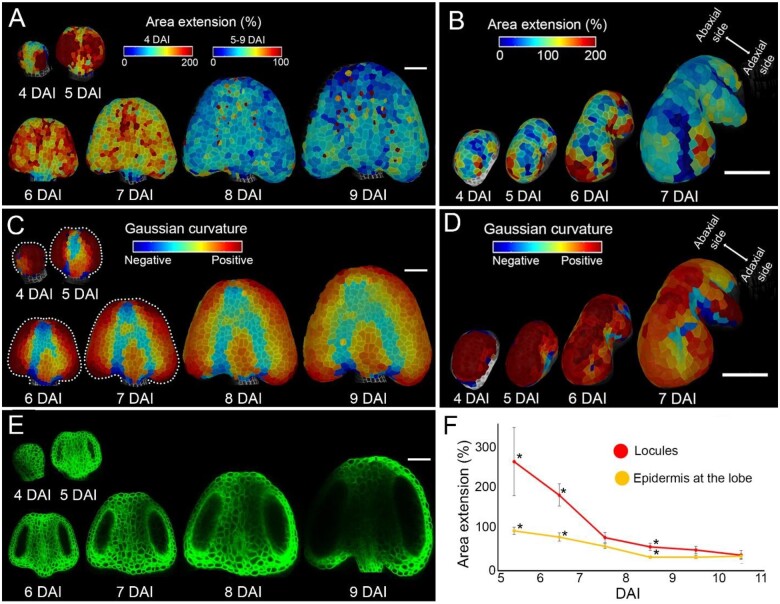
Figure 5.
Fast growth at the anther lobes correlates with early stages of locule formation. A and B, Heat maps of area extension of the abaxial (A) and adaxial (B) sides of anthers displayed on the digitally extracted organ surface. C and D, Gaussian curvature (red, positive; blue, negative) displayed on the digitally extracted abaxial (C) and adaxial (D) anther surface. Dotted lines in (C) mark stamen outlines for clarity. Heat maps generated between consecutive time points are displayed on the first time point. E, Digital longitudinal sections through the confocal stacks located in the middle of developing locules. Plasma membrane marker in green. F, Quantification of area extension of the longitudinal sections through the locules (red, n > 6 locules) and of the surface expansion of cells located at the lobe (yellow, n > 8 lobes). Error bars indicate sem. Asterisks mark the means significantly different between locules and lobe at the same time point according to Student’s t test (P < 0.05). Scale bars, 50 µm in (A–E).

