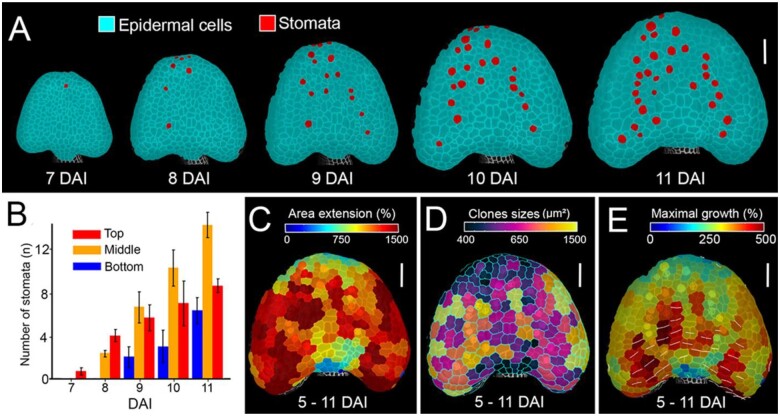
Figure 6.
Anther displays a basipetal gradient of growth and differentiation. A, Cell-type tracing in the developing anther. Stomata marked in red displayed on the digitally extracted organ surface. B, Quantification of stomata distribution from 7 to 11 DAI as a function of distance from the anther tip. Error bars indicate sem (n = 3 independent time-lapse series; n > 2 cells). C–E, Heat maps of area extension (C), sizes (D), and maximal growth (E) of clones developing from single cells at 5 DAI. White lines in (E) indicate orientation of maximum growth for clones where growth anisotropy was >60%. Scale bars, 50 µm in (A) and (C–E).

