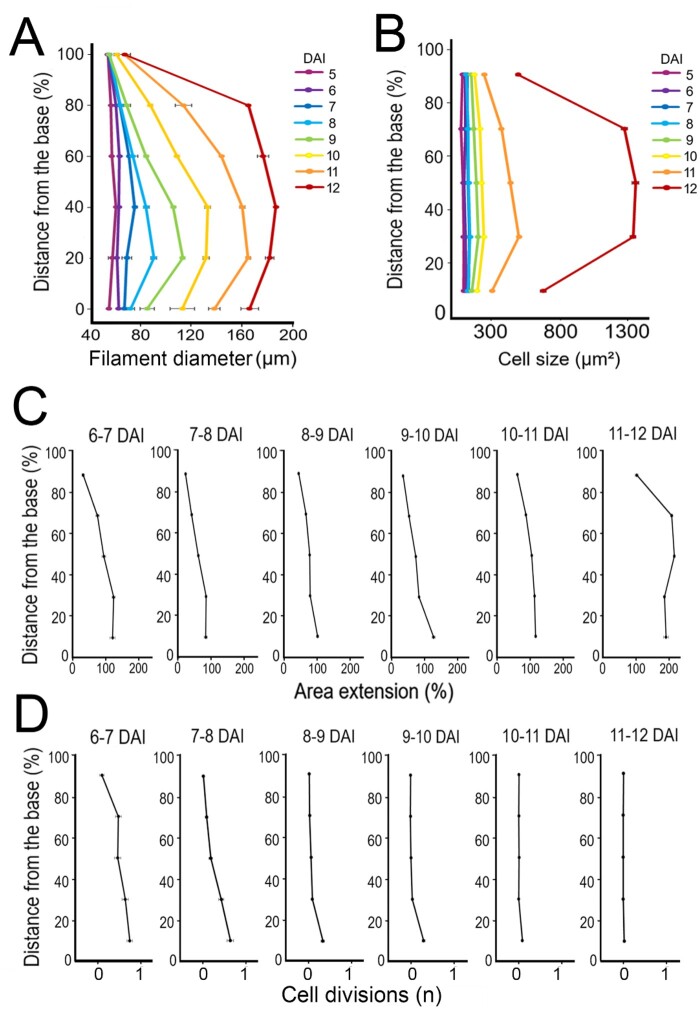
Figure 8.
Proximodistal distribution of cellular growth and proliferation during filament elongation. A and B, Alignment graphs of mean filament diameter (A), and cell size (B), from 5 to 12 DAI as a function of distance from the filament base. C and D, Quantification of area extension (C) and cell divisions (D), from 5 to 12 DAI as a function of distance from the filament base. Error bars indicate standard error of the mean (nine independent time-lapse series; n > 127 cells).

