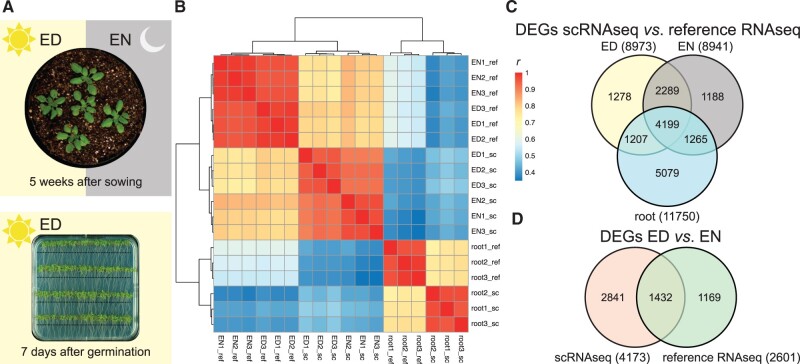
Figure 1.
Experimental overview with clustering and DEGs. A, Roots were harvested at the ED from 7-d-old plants approx. 1 cm below the hypocotyl (indicated by the black line); the above-ground tissue was harvested at the ED and EN from 5-week-old plants. For the single-cell samples, the tissue was harvested 75 min before the ED (or EN) time point and used for protoplast preparation. For the reference RNAseq libraries, the tissue was harvested 15 min before the ED (or EN) time point and shock frozen in liquid nitrogen. B, Hierarchical clustering of the sequenced scRNAseq (sc) and reference RNAseq (ref) libraries using Pearson’s correlation coefficient (r) as distance measure. C, Venn diagram of DEGs between scRNAseq and reference RNAseq for the different timepoints and tissues. D, Venn diagram of DEGs between ED and EN for scRNAseq and reference RNAseq. DEGs are defined as |log2FC| ≥ 1 and FDR of 0.05.

