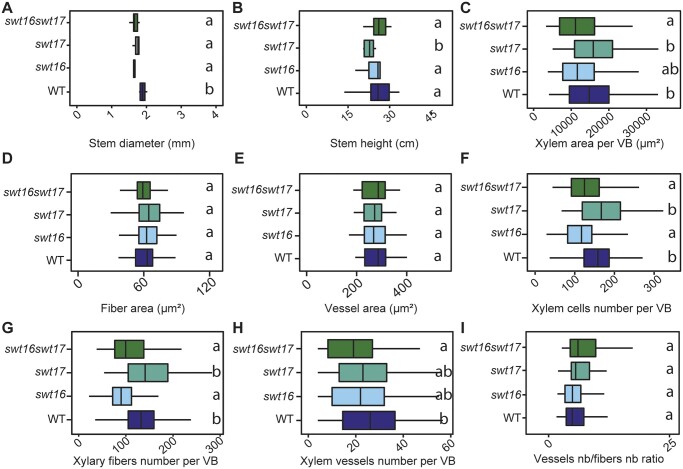
Figure 3.
Knockout of SWEET16 gene expression impacts the proliferation of xylem cells. A–I, Boxplots showing the inflorescence stem height (A) and diameter (B), the cross-sectional area occupied by xylem tissue per vascular bundle (C), the average cross-sectional area of a xylary fiber (D) or of a xylem vessel (E), and the average number of xylem cells (F), of xylary fiber vessels (G), of xylem vessels (H) per vascular bundle and the ratio of vessel number to fiber number (I). The box and whisker plots represent values from five to seven independent plants (A and B) or from 71, 53, 41, and 50 individual vascular bundles from the wild-type, swt16, swt17, and swt16swt17 plants, respectively, coming from five to seven independent plants for each genotype (C–I). The lines represent median values, the tops and bottoms of the boxes represent the first and third quartiles, respectively, and whisker extremities represent maximum and minimum data points. A one-way analysis of variance combined with the Tukey’s comparison post hoc test was performed. The values marked with the same letter were not significantly different from each other, whereas different letters indicate significant differences (P < 0.05).

