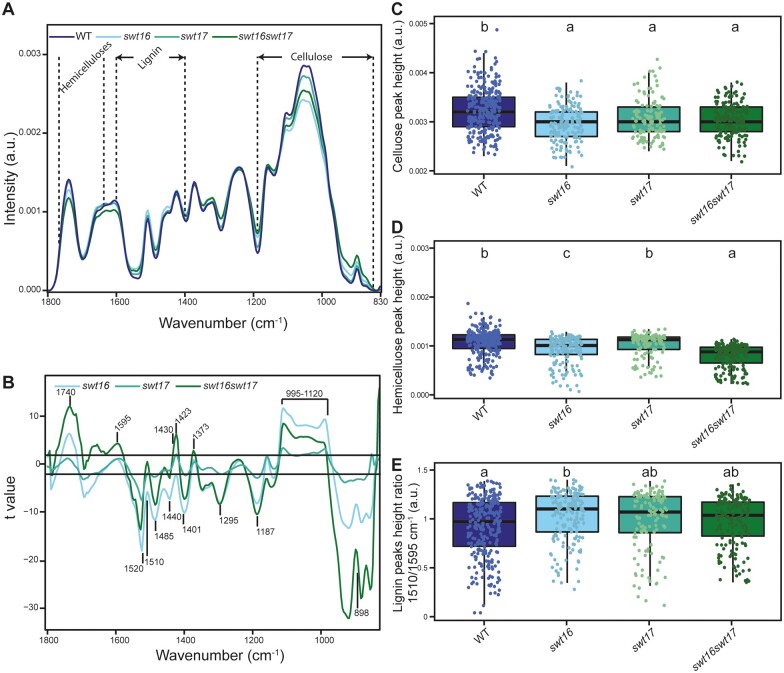
Figure 5.
The composition of the xylem secondary cell wall is altered in the swt16swt17 double mutant. FTIR spectra were acquired on xylem tissue from sections of the basal part of the inflorescence stem. All spectra were baseline-corrected and area-normalized in the range 1800–800 cm−1. A, Average FTIR spectra were generated from 266, 170, 123, and 170 spectra for the wild-type, swt16, swt17, and swt16swt17 plants, respectively, obtained using three independent plants for each genotype. B, Comparison of FTIR spectra obtained from xylem cells of the swt16, swt17, and swt16swt17 mutants. A Student’s t test was performed to compare the absorbances for the wild-type, single, and double mutants. The results were plotted against the corresponding wavenumbers. t-Values (vertical axis) between −2 and +2 correspond to nonsignificant differences (P < 0.05) between the genotypes tested (n = 3). t-Values above +2 or below −2 correspond to, respectively, significantly weaker or stronger absorbances in the mutant spectra relative to the wild-type. C–E, Boxplots of the cellulose (C–O vibration band at 1,050 cm−1) (C), hemicellulose (C–O and C–C bond stretching at 1,740 cm−1) (D) peak height and lignin peak height ratio (1,510/1,595 cm−1) (E). The lines represent median values, the tops and bottoms of the boxes represent the first and third quartiles, respectively, and the ends of the whiskers represent maximum and minimum data points. The boxplots represent values (shown as colored dots) from 266, 170, 123, and 170 spectra from the wild-type, swt16, swt17, and swt16swt17 plants, respectively, obtained from three independent plants for each genotype. A one-way analysis of variance combined with the Tukey’s comparison post hoc test was performed. Values marked with the same letter were not significantly different from each other, whereas different letters indicate significant differences (P < 0.05).

