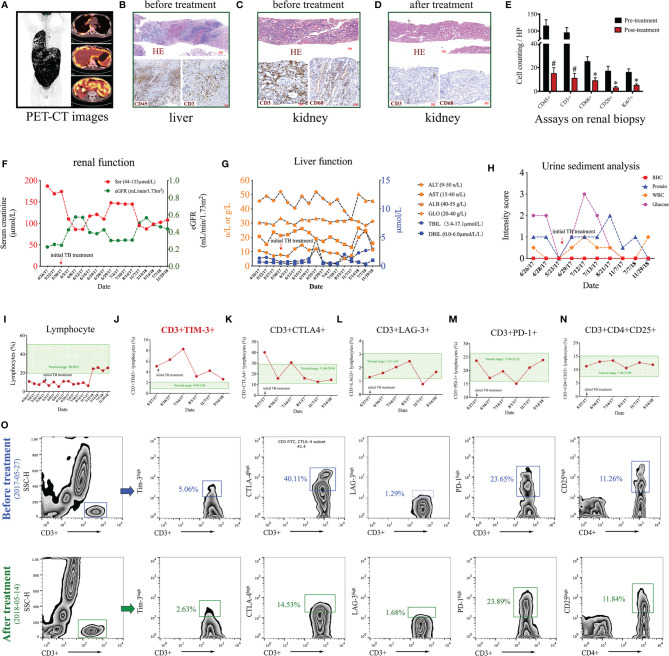
Figure 1.
Clinical data of a case of Mycobacterium tuberculosis (Mtb) infection. (A) PET-CT images. (B) Liver biopsy before anti-Mtb treatment with HE and immunohistochemical staining using antibodies against CD45 and CD3. (C–E) Renal biopsies before (C) and after (D) anti-Mtb treatment and quantitative analysis (E) on kidney interstitial cells by expressions of CD45, CD3, CD68, CD20, and Ki67. (F–I) Time-course of renal function (F), liver function (G), urine sediment (H), and circulating lymphocyte ratio (I). (J–N) Time-course of flow cytometry assays on different subsets of circulating T cells, including CD3+TIM 3+ (J), CD3+CTLA-4+ (K), CD3+LAG-3+ (L), and CD3+PD1+ (M), and CD3+CD4+CD25+ (N). (O) Gating strategies and representative figures of flow cytometry assays. *P < 0.01, #P < 0.001.

