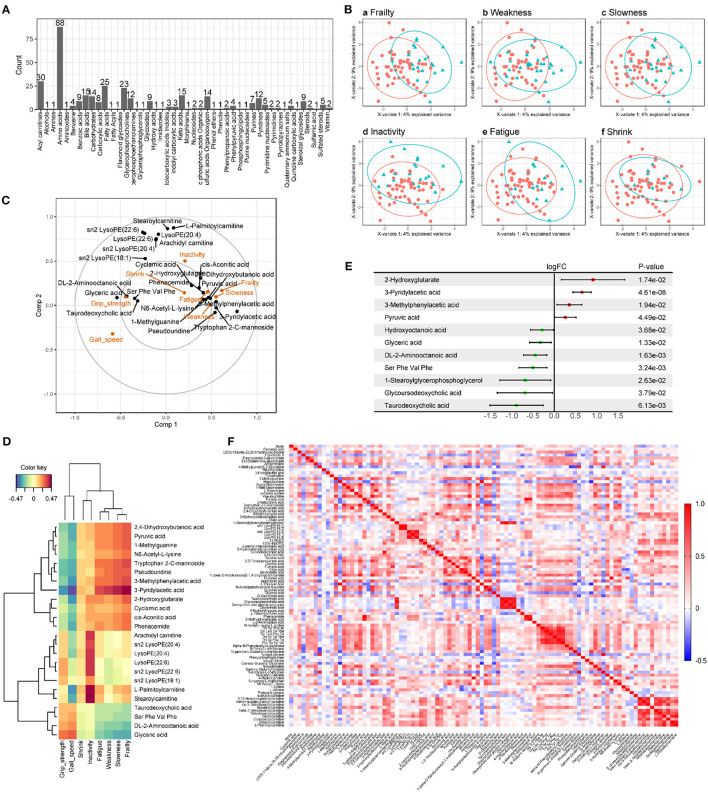
Figure 1.
Metabolomics analysis of serum from older adults. (A) Metabolome summary. There were 349 metabolites in 46 categories detected from serum samples of participants, among which Amino acids had the most identified species (88). (B) The sparse partial least squares (sPLS) regression score plots of the first two components within each pair of groups. The green triangle represents the case group (frailty, weakness, slowness, inactivity, fatigue, and shrink are shown in Ba–f), the red circle represents the control group, and the ellipses represent the 95% confidence regions for each group. As the score plots show, the metabolites detected have well-separated within groups. (C) Correlation circle plot for the first two sPLS components. The projection of each variable on the axis represents the correlation between the variable and the corresponding component. To simplify the plot, 16 and 8 metabolites were retained in Comp1 and Comp2, respectively. (D) Heat map of correlation between the clinical variables associated with frailty phenotype and 24 metabolites from the first two components in sPLS regression. Negative and positive correlations are shown in blue and red ranging from −0.47 to 0.47. (E) Forest plot of different metabolites for frailty identified by limma package of R with P < 0.05. Serum of frail older adults had higher levels of 4 metabolites and lower levels of 7. (F) Heat map of Pearson correlation analysis of 96 metabolites associated with gait speed or grip strength. Negative and positive correlations are shown in blue and red ranging from −0.5 to 1.0.

