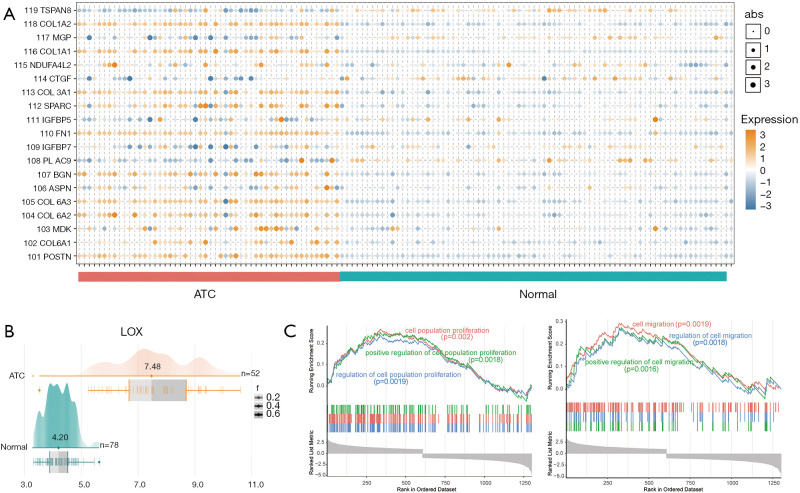
Figure 2.
The expression of LOX was upregulated in ATC tissues and cell lines. (A) Heatmaps representing the upregulated and downregulated top 20 LOX-related genes in ATC and normal subsets using microarray analysis. (B) The expression level of LOX in the ATC and normal groups (7.48 vs. 4.20). (C) GSEA showing high-LOX groups are associated with cell proliferation- and migration-related GO pathways. LOX, Lysyl oxidase; ATC, anaplastic thyroid carcinoma; GSEA, gene set enrichment analysis; GO, Gene Ontology.

