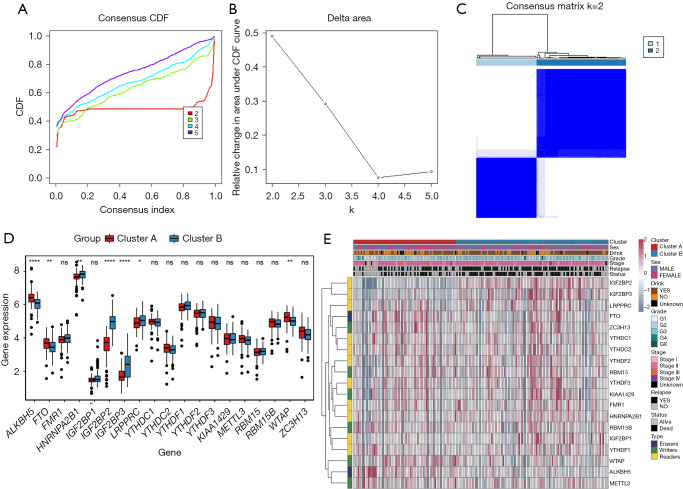
Figure 2.
Identification of consensus clusters based on the similarity of expression of m6A regulators. (A) Consensus clustering CDF for K=2 to 5; (B) relative change in the area under CDF curve for K=2 to 5; (C) consensus clustering matrix for K=2; (D) boxplot of m6A regulators, comparing cluster B and cluster A; (E) hierarchical clustering of 5 constituent genes of the risk signature, along with clinicopathological characteristics. *, P<0.05; **, P<0.01; ****, P<0.0001. ns represents no statistical significance. CDF, cumulative distribution function.

