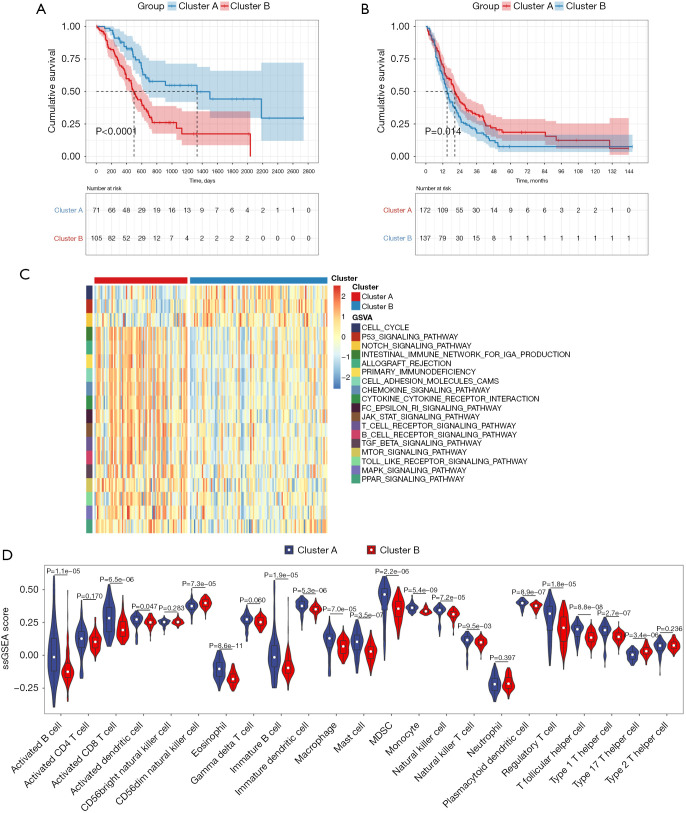
Figure 3.
Kaplan-Meier analysis and GSVA enrichment analysis and ssGSEA analysis between cluster B and cluster A subtype. (A) The overall survival curves of the cluster B and cluster A in TCGA-PDAC cohort; (B) the overall survival curves of the cluster B and cluster A in GEO datasets; (C) GSVA enrichment analysis revealing the biological pathways in cluster B and cluster A subtype. The hierarchical clustering was applied to show these biological processes; (D) comparison of immune cell Infiltration among in cluster B and cluster A subtype using ssGSEA analysis. GSVA, gene set variation analysis; TCGA, The Cancer Genome Atlas; PDAC, pancreatic ductal adenocarcinoma; GEO, Gene Expression Omnibus.

