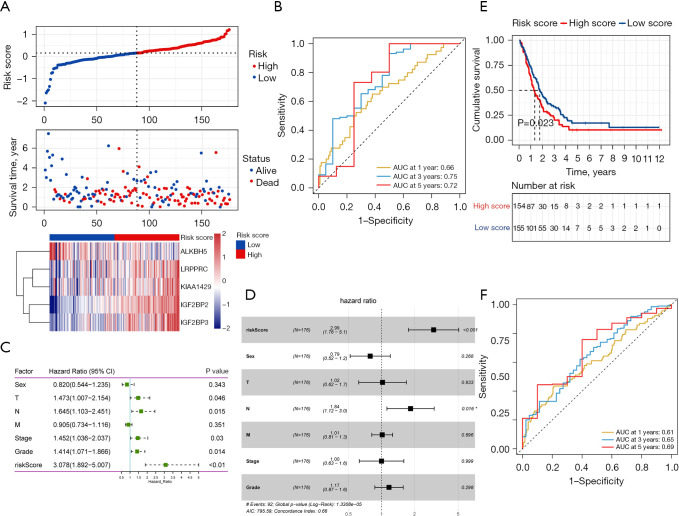
Figure 6.
Risk score, time-dependent ROC plots and independent prognostic parameters and prognostic model validation in the high-risk group and low-risk group. (A) Risk score distribution, survival overview, and hierarchical clustering for PDAC patients in TCGA-PDAC cohort. x-axis represents the sample size; (B) time-dependent ROC curves according to the 1-, 3- and 5-year overall survival status in TCGA-PDAC cohort; (C) results of the univariate Cox regression analyses regarding OS in TCGA-PDAC cohort; (D) results of the multivariate Cox regression analyses regarding OS in TCGA-PDAC cohort; (E) the OS curves of the low-risk group and the high-risk group in the GEO validation cohort; (F) time-dependent ROC curves according to the 1-, 3- and 5-year OS status in in the GEO validation cohort. ROC, receiver operating characteristic; PDAC, pancreatic ductal adenocarcinoma; TCGA, The Cancer Genome Atlas; OS, overall survival; GEO, Gene Expression Omnibus.

