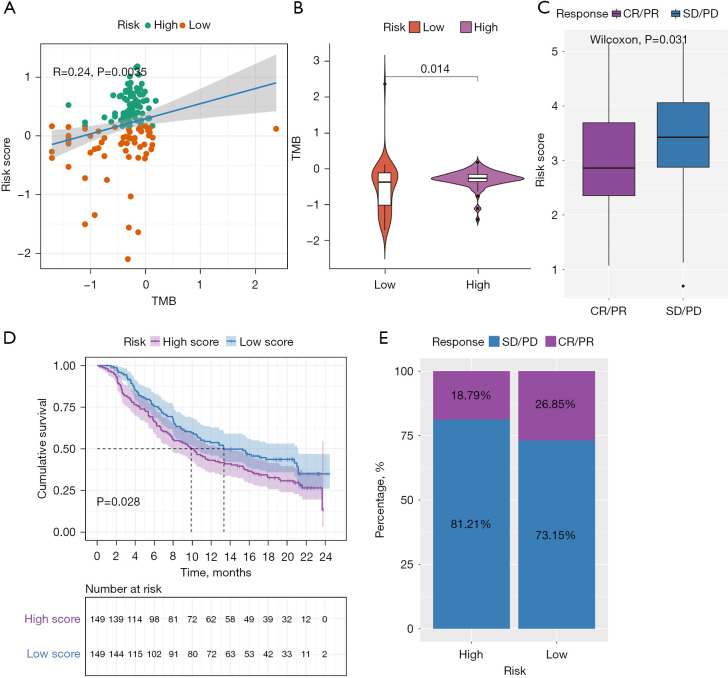
Figure 7.
Evaluation of the association between the risk score with the TMB, and revealing the role of risk score in predicting the value of checkpoint blocking immunotherapy. (A) Correlation analysis between risk score and TMB; (B) violin diagram of TMB in the high- and low-risk group; (C) distribution of the risk score in the distinct anti-PD-L1 clinical response group; (D) survival plot showed a significant survival benefit in the low-risk group classified in the IMvigor210 cohort; (E) the proportions of clinical response to anti-PD-L1 immunotherapy in the high-and low-risk score groups. TMB, tumor mutation burden.

