Figure 9.
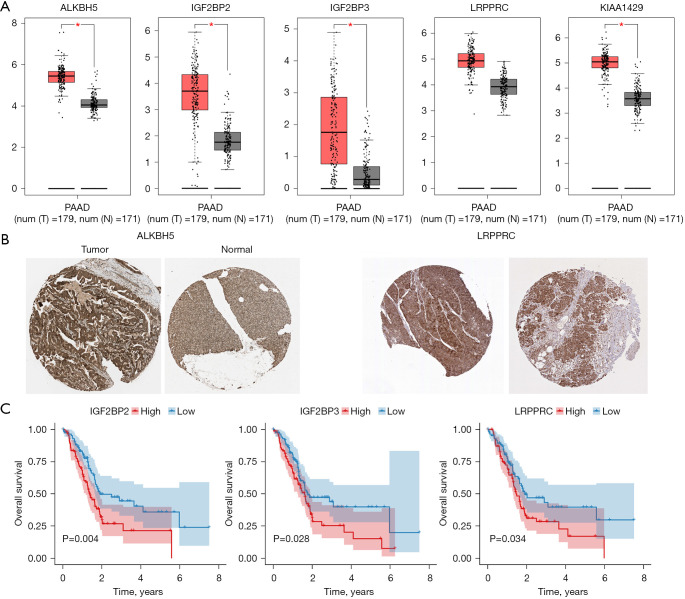
Gene and protein expression levels and survival analysis of the m6A methylation regulators. (A) The expression analysis of ALKBH5, IGF2BP2, IGF2BP3, LRPPRC, and KIAA1429 was performed using GEPIA. *, P<0.05; (B) the expression levels of ALKBH5 and LRPPRC in PDAC tumor tissues were obtained from THPA (magnification ×20); (C) survival analysis of IGF2BP2, IGF2BP3, and LRPPRC in TCGA-PDAC cohort. GEPIA, Gene Expression Profiling Interactive Analysis; THPA, The Human Protein Atlas; PDAC, pancreatic ductal adenocarcinoma.

