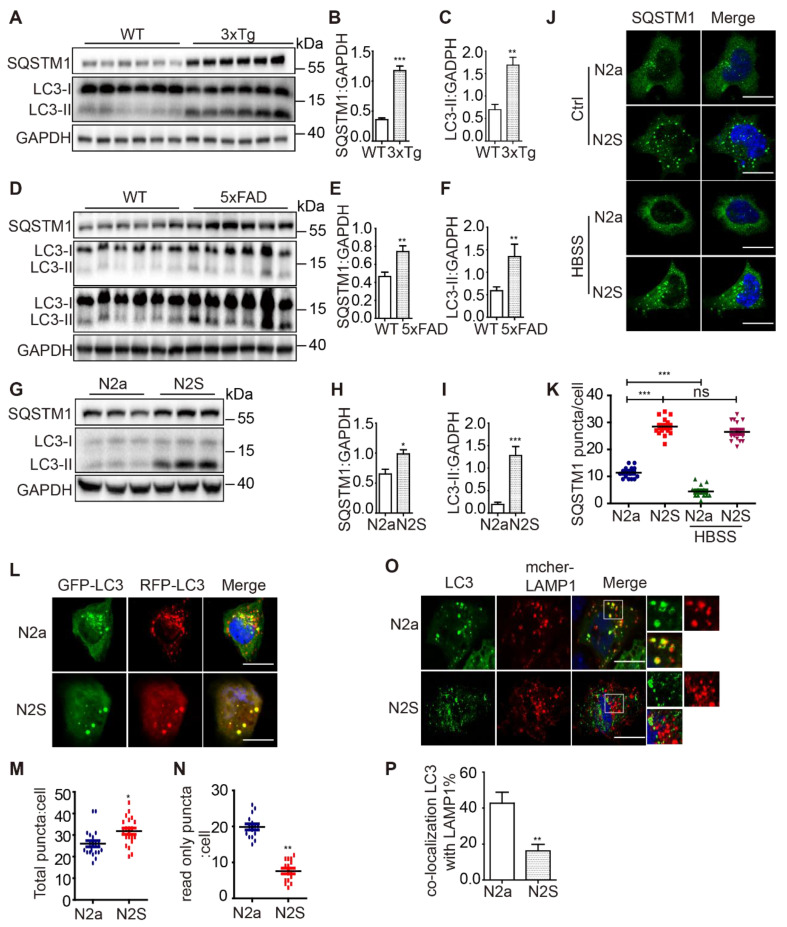
Figure 1.
AD cell and mice models exhibit inhibition of autophagosome maturation. (A) Immunoblotting was used to detect the expression of LC3 and SQSTM1 in the hippocampus region of 12-month-old C57BL/6, 3xTg AD mice. (C-B) Quantitative data in panel Figure 1A. Data are quantified as mean ± SEM (n = 3). *P < 0.05, **P < 0.01, ***P < 0.001 vs. the relative control. (D) Immunoblotting was used to detect the expression of LC3 and SQSTM1 in the hippocampus region of 12-mo-old 5xFAD AD mice. (E-F) Quantitative data in panel Figure 1D. Data are quantified as mean ± SEM (n =3). *P < 0.05, **P < 0.01, ***P < 0.001 vs. the relative control. (G) Immunoblotting was used to detect the expression of LC3 and SQSTM1/p62 in the APP over-expressed N2S cells. (H-I) Quantitative data in panel Figure 1G. Data are quantified as mean ± SEM (n = 3). *P < 0.05, **P < 0.01, ***P < 0.001 vs. the relative control. (J-K) SQSTM1 levels were determined by immunofluorescence. Quantification data are presented as the mean ± SEM, n = 20-25 cells from 3 independent experiments. ***P < 0.001 vs. the relative control, ns, not significant. Scale bar, 7.5 μm. (L-N) Autophagosome maturation in N2a and N2S cells was determined by the GFP-RFP-LC3 probe. Quantification data are presented as the mean ± SEM, n = 20-25 cells from 3 independent experiments. Scale bar, 7.5 μm. (O-P) N2a and N2S cells were transiently transfected with GFP-Lc3 and mCherry-LAMP1, the colocalization of autophagosomes and lysosomes was visualized under confocal microscope. Quantification data are presented as the mean ± SEM, n = 20-25. *P < 0.05, **P < 0.01, ***P < 0.001 vs. the relative control. Scale bar, 7.5 μm.

