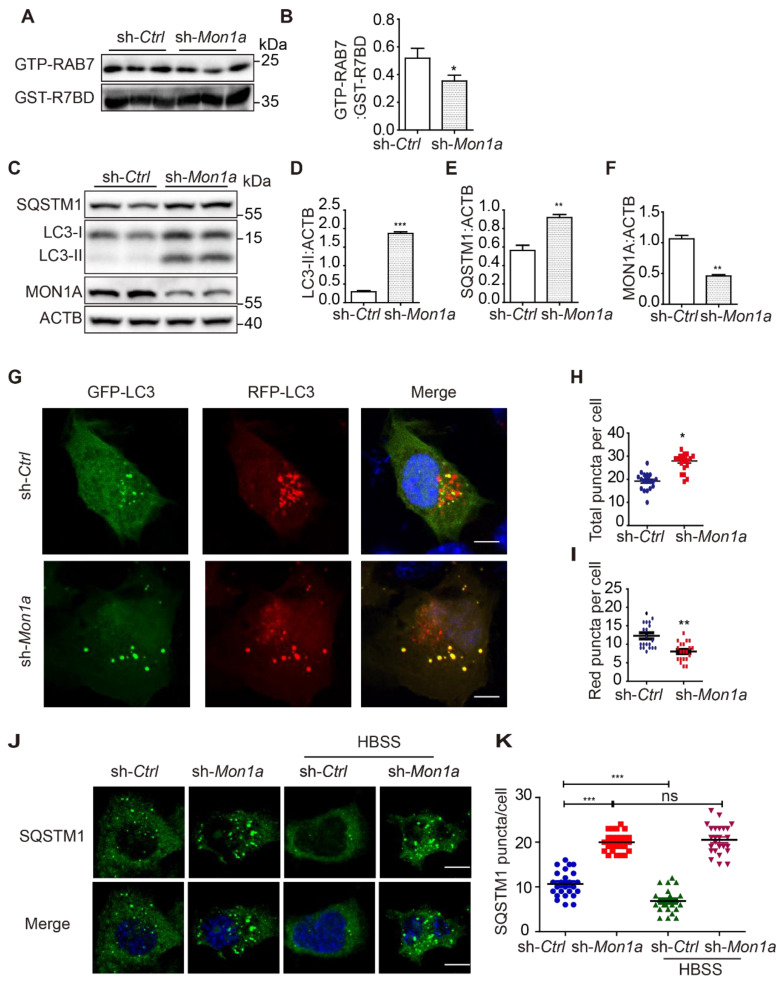
Figure 4.
(A-B) N2S cells were transfected with Mon1a shRNA or nontargeting shRNA. The level GTP-RAB7 were detected by GST-R7BD affinity-isolation assay. Data are quantified as mean ± SEM (n = 3). *P < 0.05, **P < 0.01, ***P < 0.001 vs. the relative control. (C-F) Cells were transfected with Mon1a shRNA, and the levels of SQSTM1 and LC3-II were examined by immunoblotting. *P < 0.05, **P < 0.01, ***P < 0.001 vs. the relative control. (G-I) Autophagosome maturation in N2a cells transfected with Mon1a shRNA or nontargeting shRNA were determined by the GFP-RFG-LC3 probe. Quantification data are presented as the mean ± SEM, n = 20-25 cells from 3 independent experiments. *P < 0.05, **P < 0.01, vs. the relative control. Scale bar: 5 μm. (J-K) SQSTM1 levels were determined by immunofluorescence in control and Mon1a KD cells. Quantification data are presented as the mean ± SEM, n = 20-25 cells from 3 independent experiments. *P < 0.05, **P < 0.01, vs. the relative control. Scale bar: 5 μm.

